VizNoodles
A random collection of data viz doodles
July 2025. I wanted to represent abstraction, and at the same time I was reminded of the horses animation by Eadweard Muybridge by watching the talk from From Form.
July 2025. I knew what it was ok? I just didn't know that was the right name.
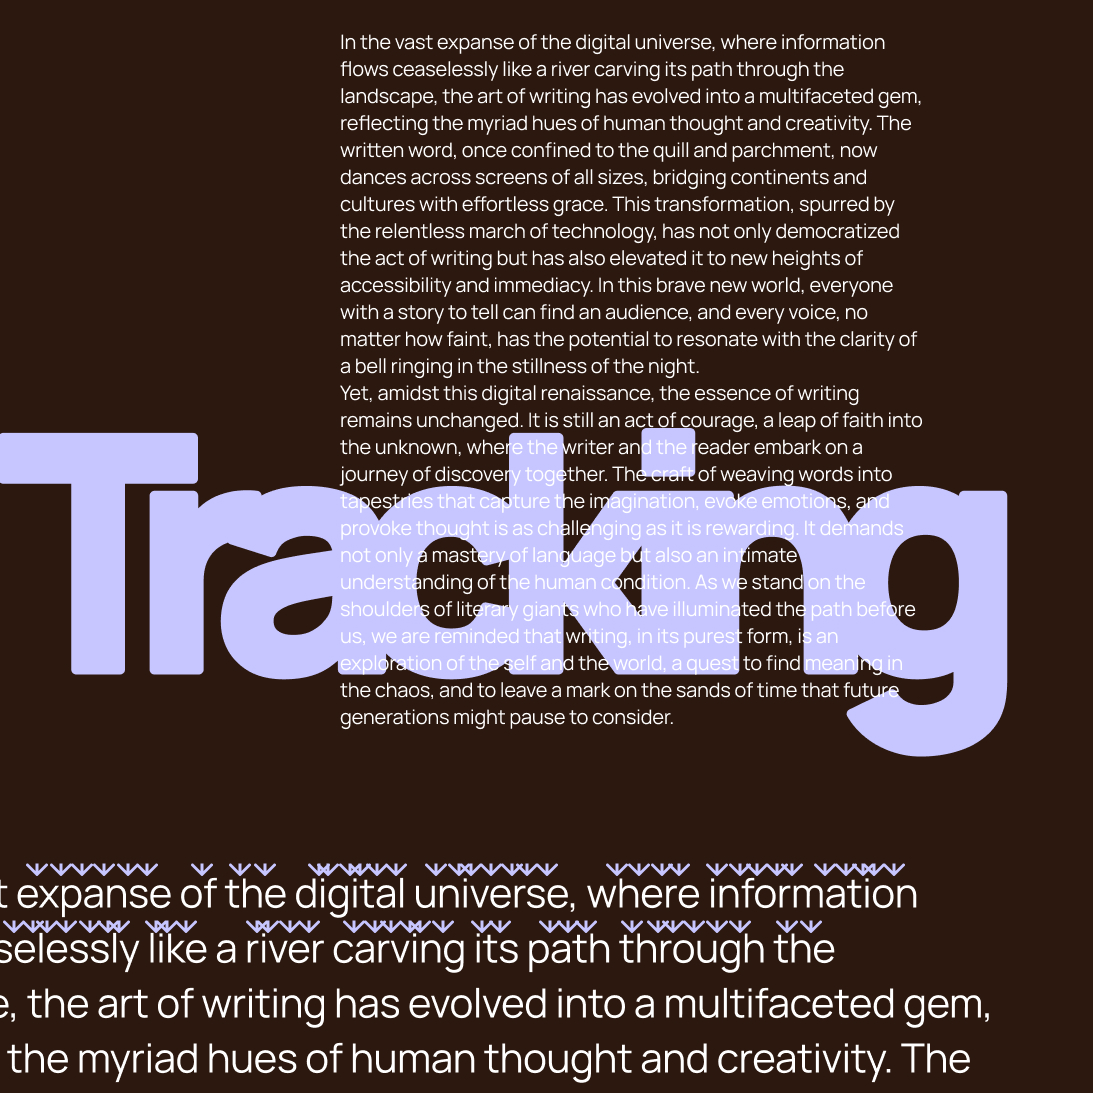
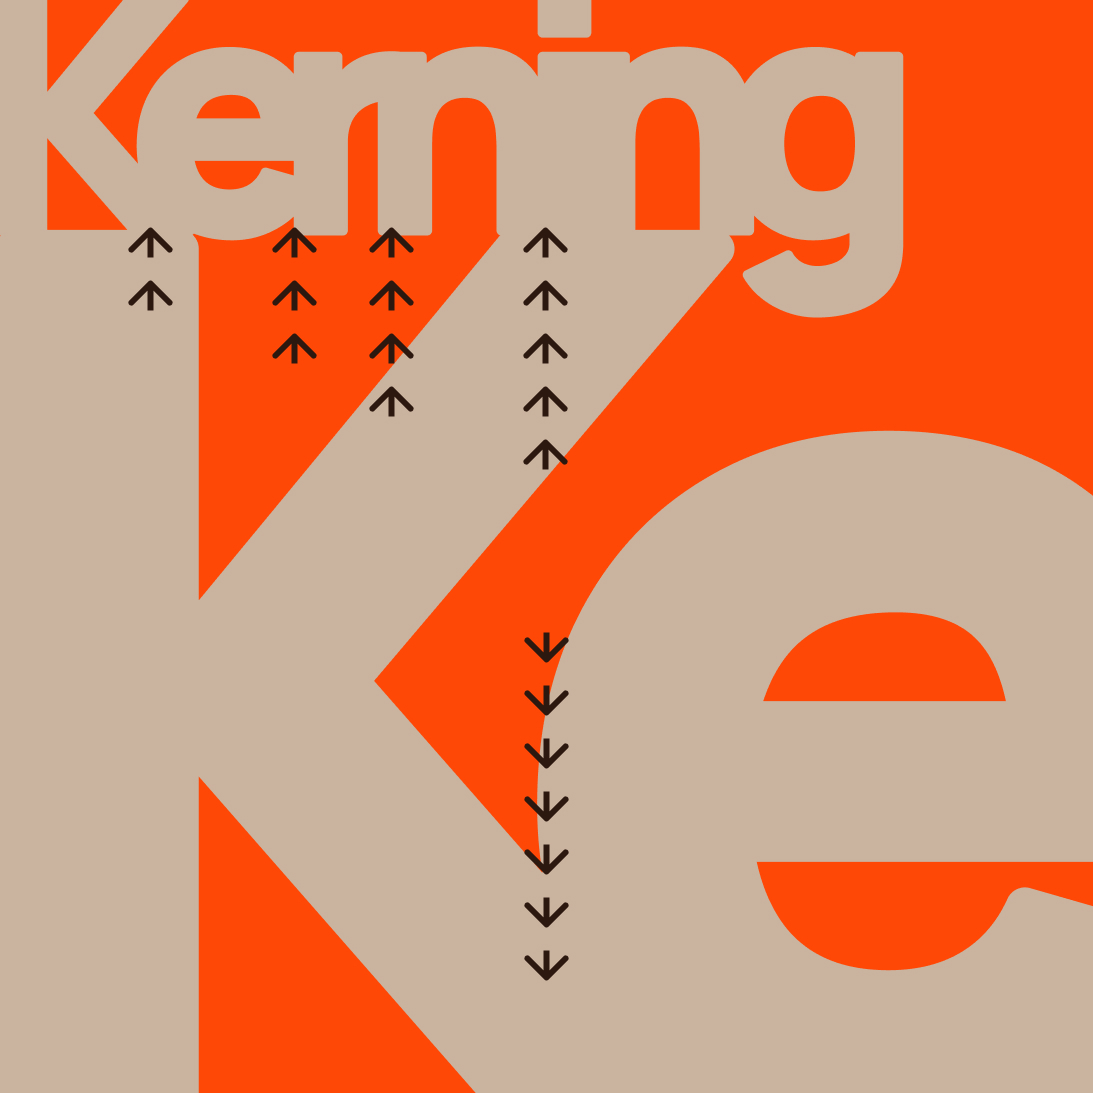
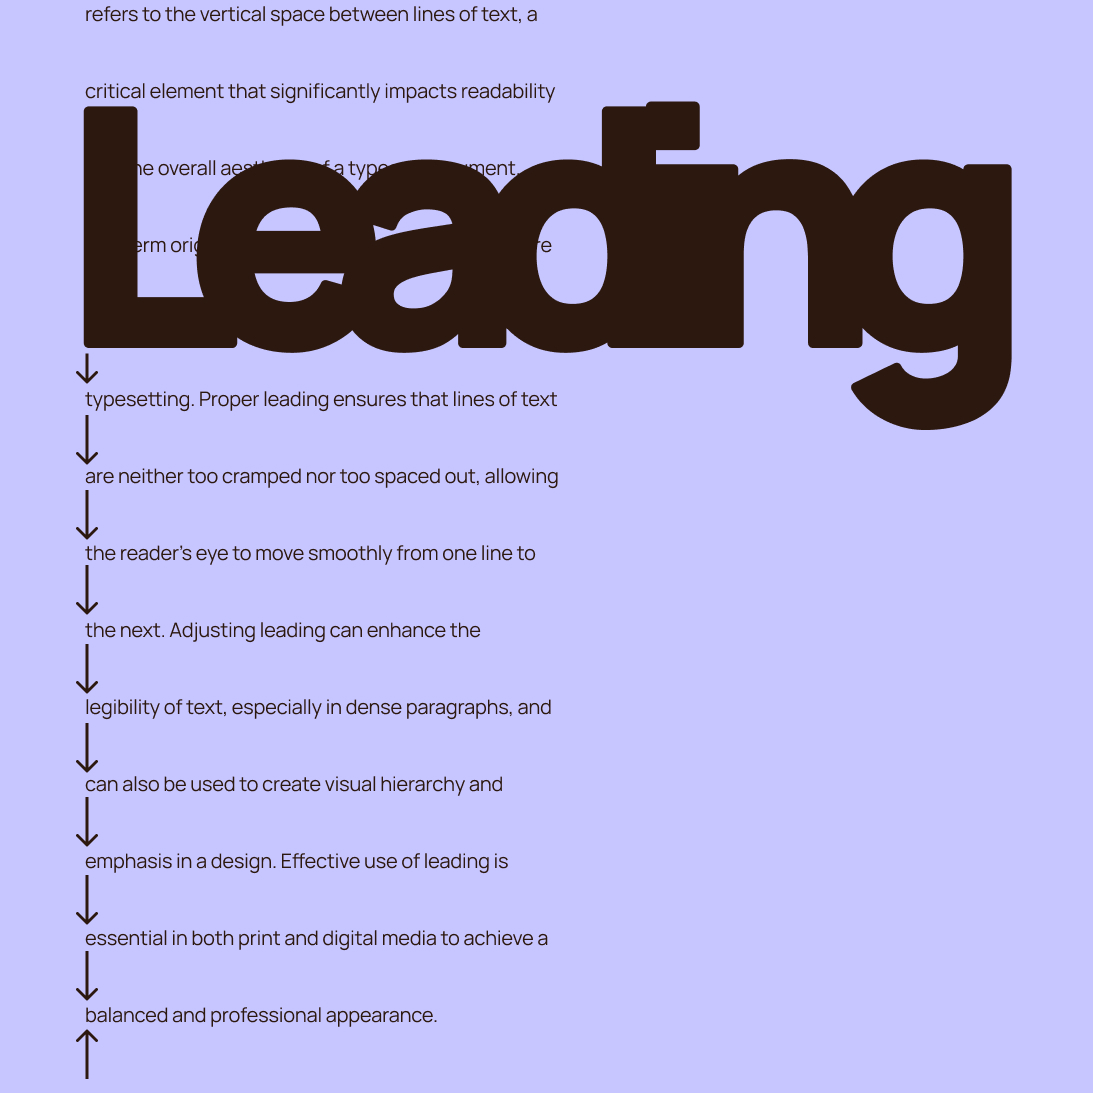
July 2025. I wanted to refresh my poor memory on some very basic typography terms.
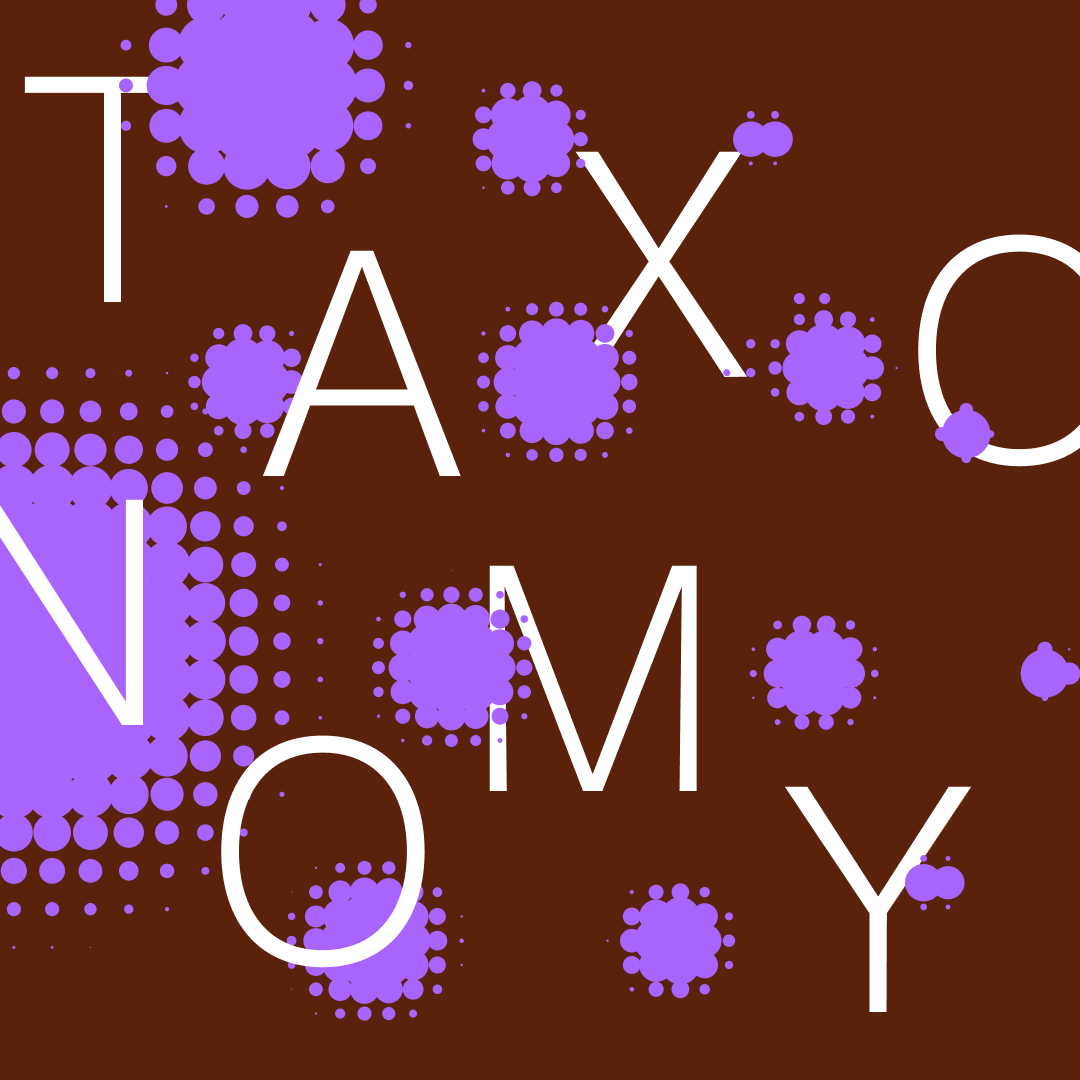
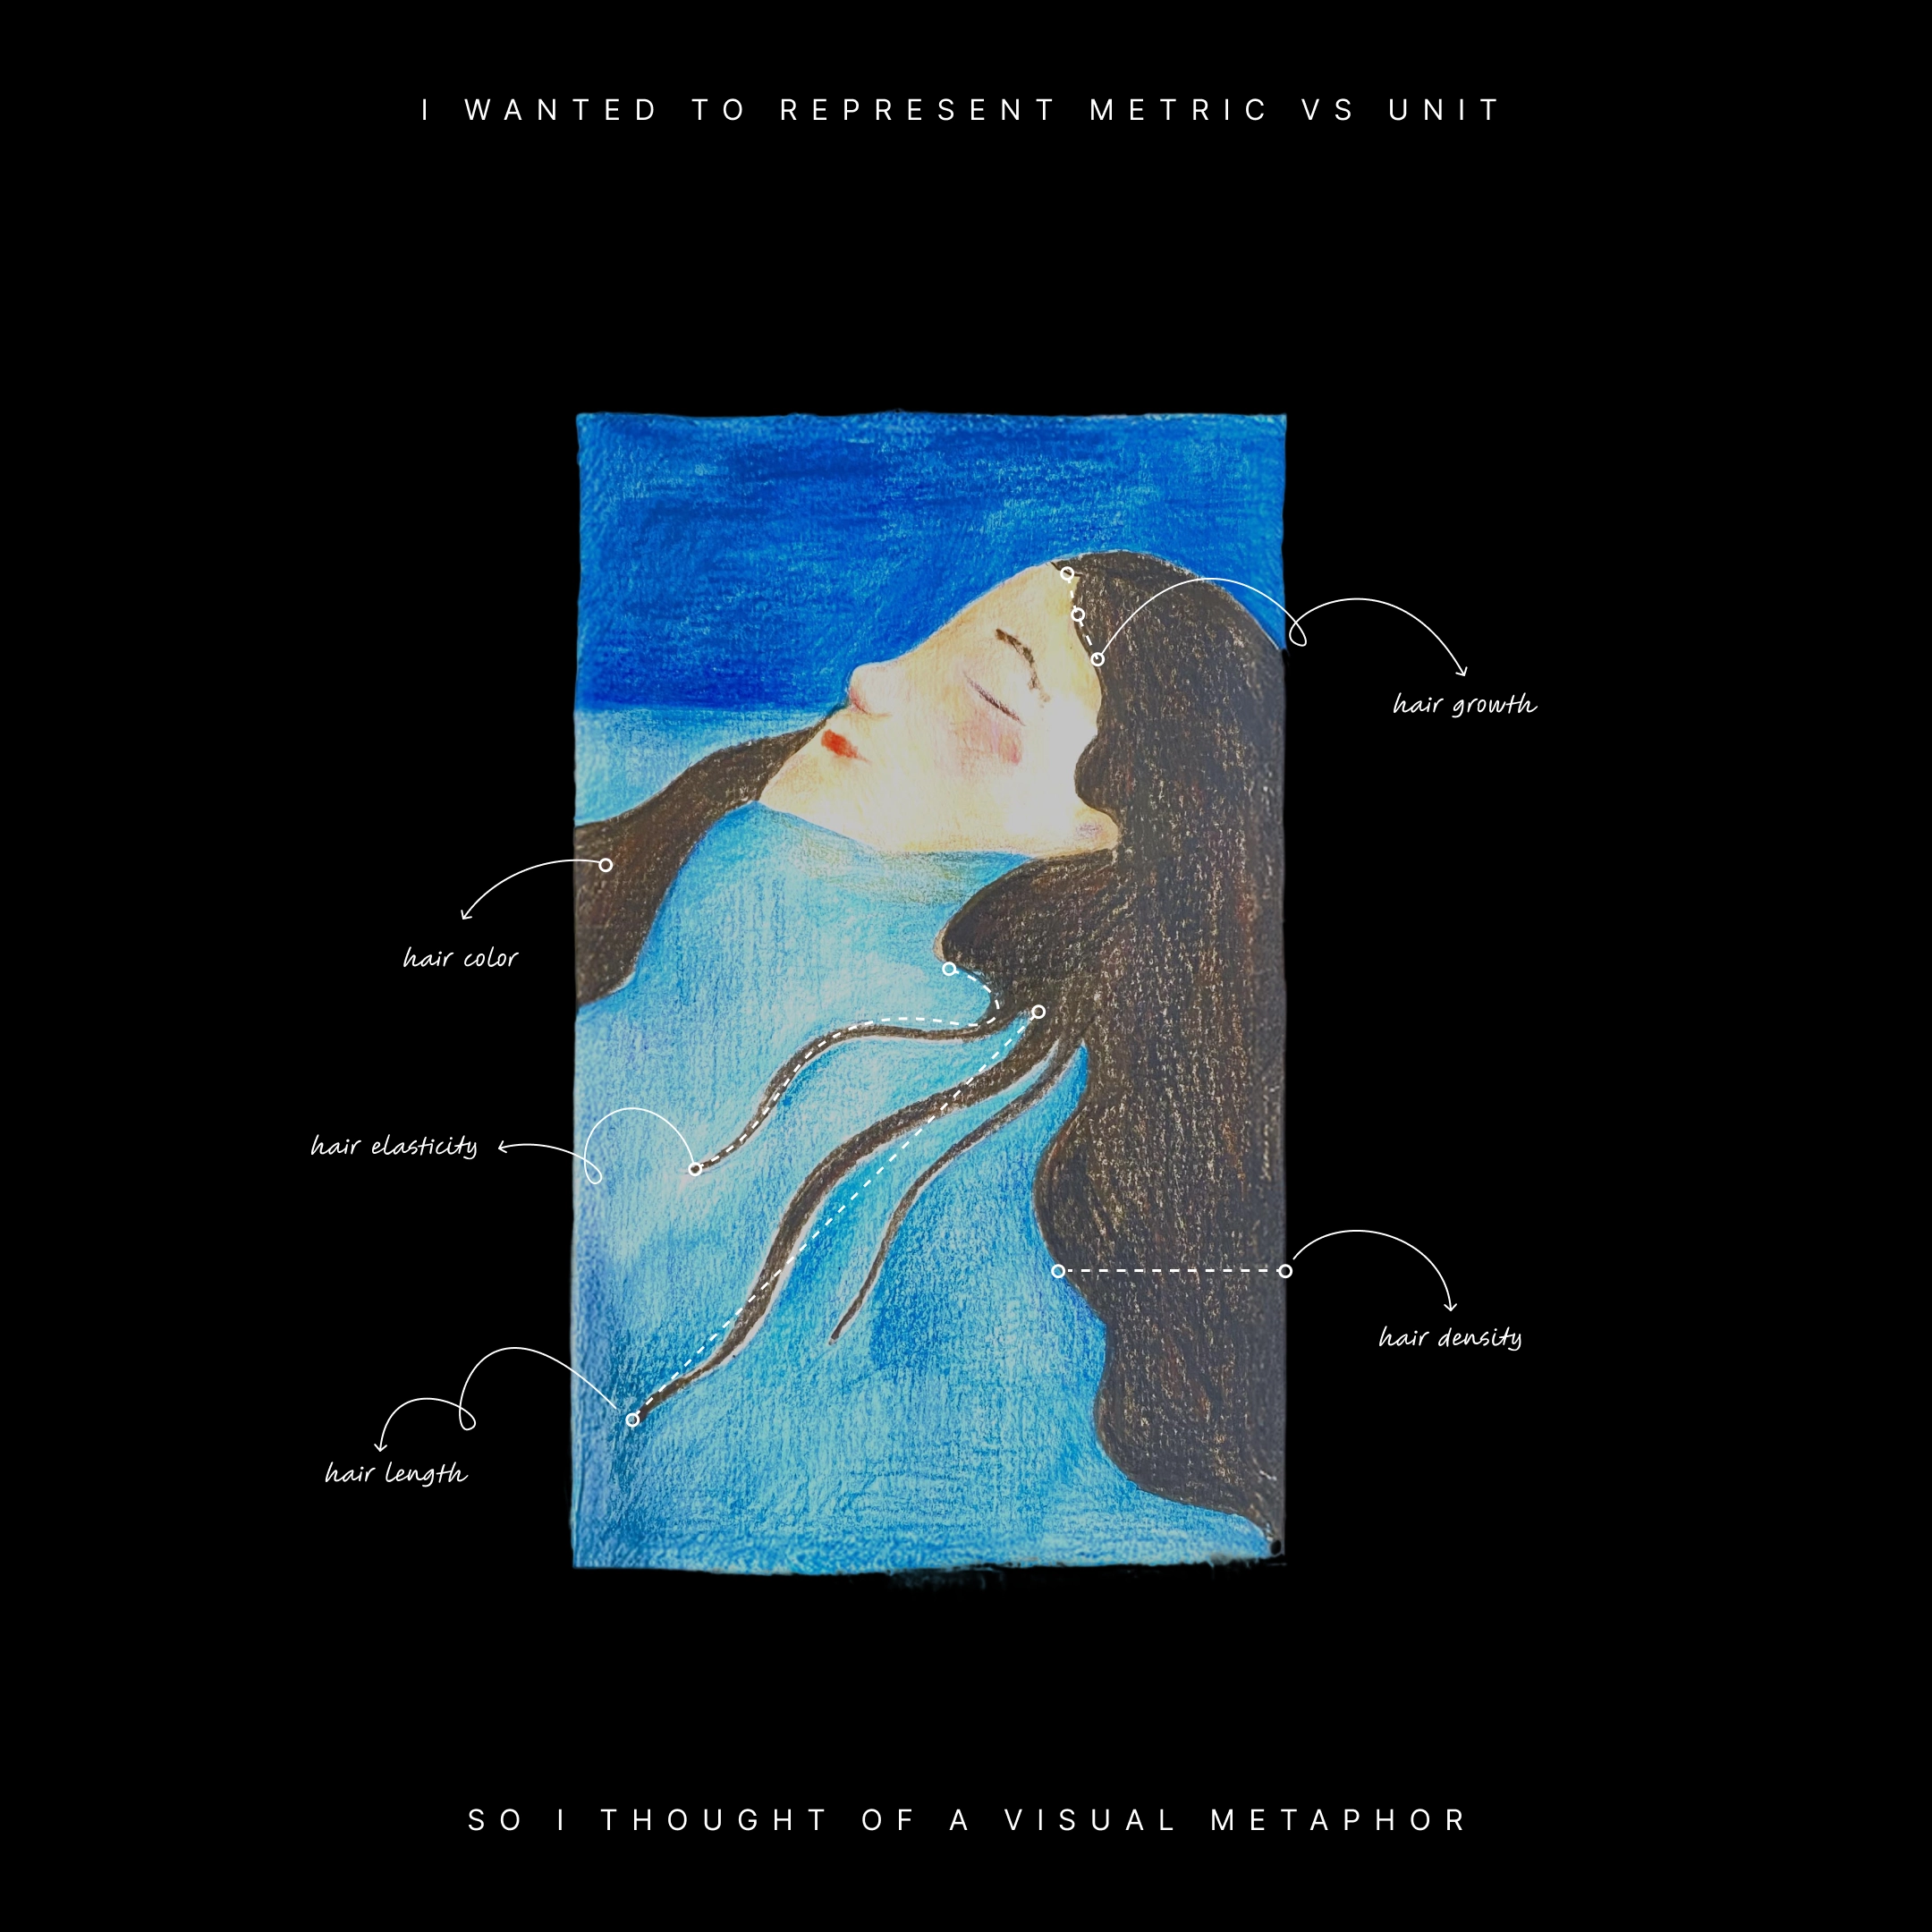
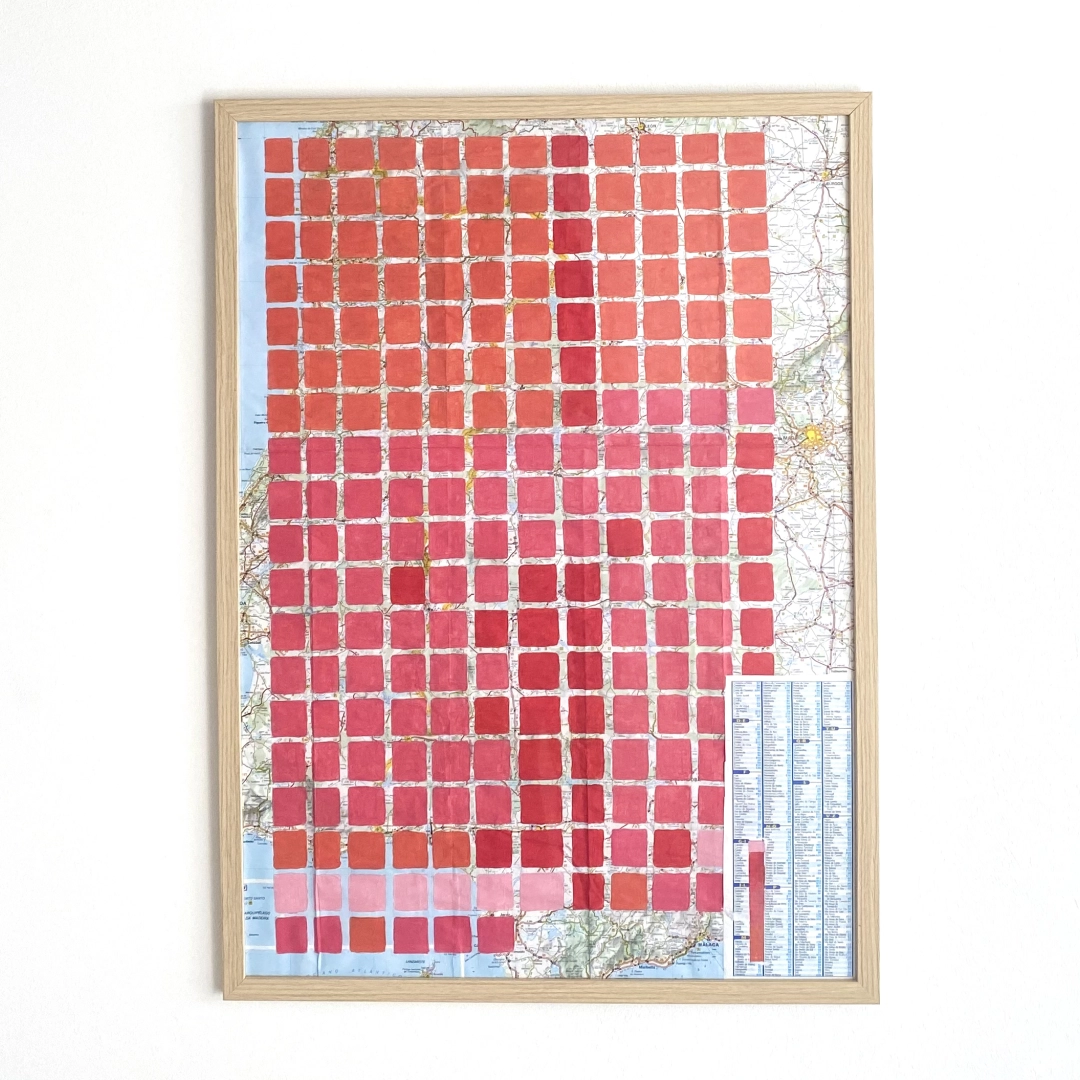
June 2025. Taxonomy sounds like a smart word, and it kinda is. "The the branch of science concerned with classification, especially of organisms."
June 2025. I heard someone say "Artistic statement into a creative dialogue" and thought it was beautiful Plus, I made a p5 tool so I could get these cool haltfone effects. Felt good.
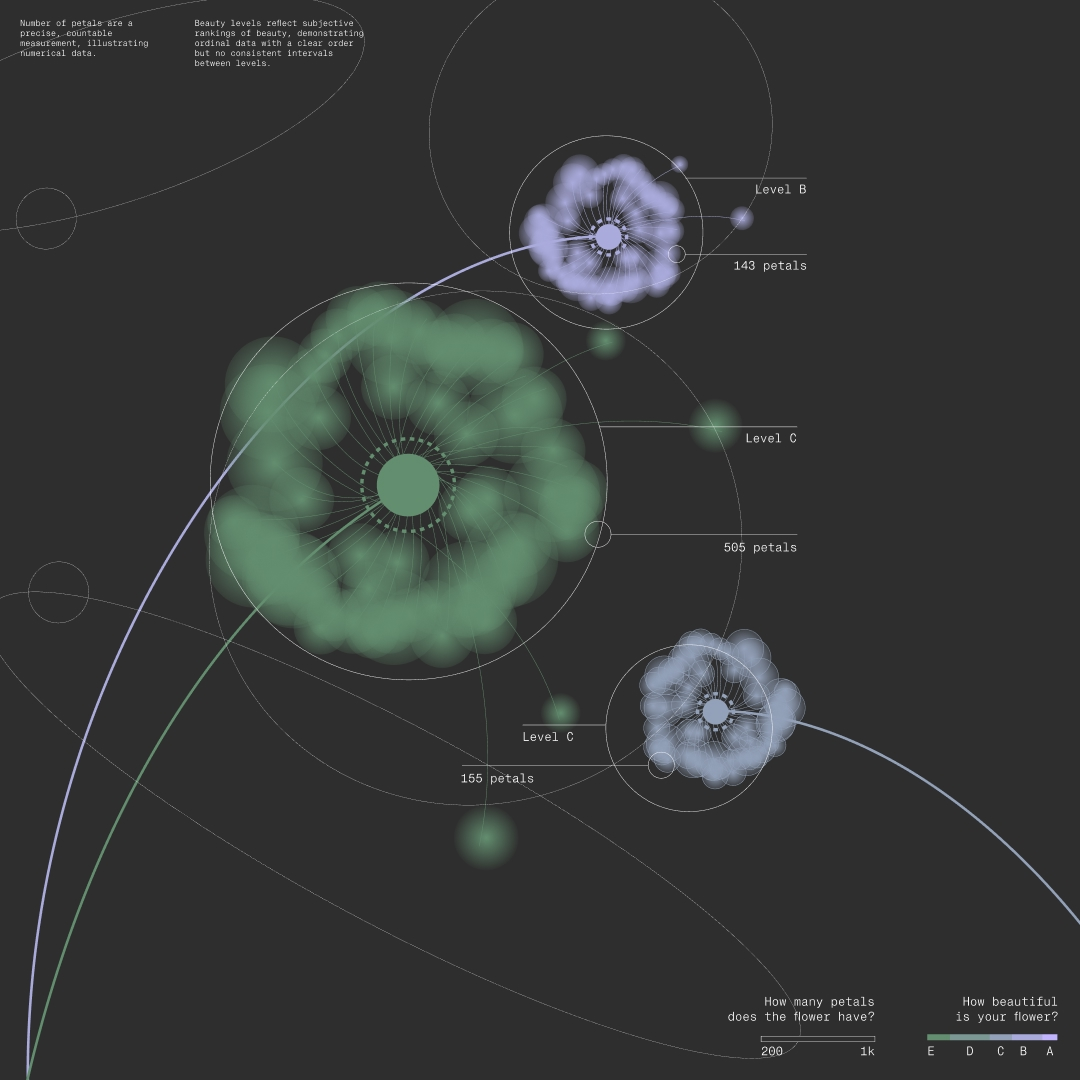
April 2025. I want was thinking about ordinal and numerical so I picked a visual representation with flowers. Bit of a stretch, but hey that's life. A flower's petal count (numerical) and beauty ranking (ordinal) illustrate how both data types can coexist.
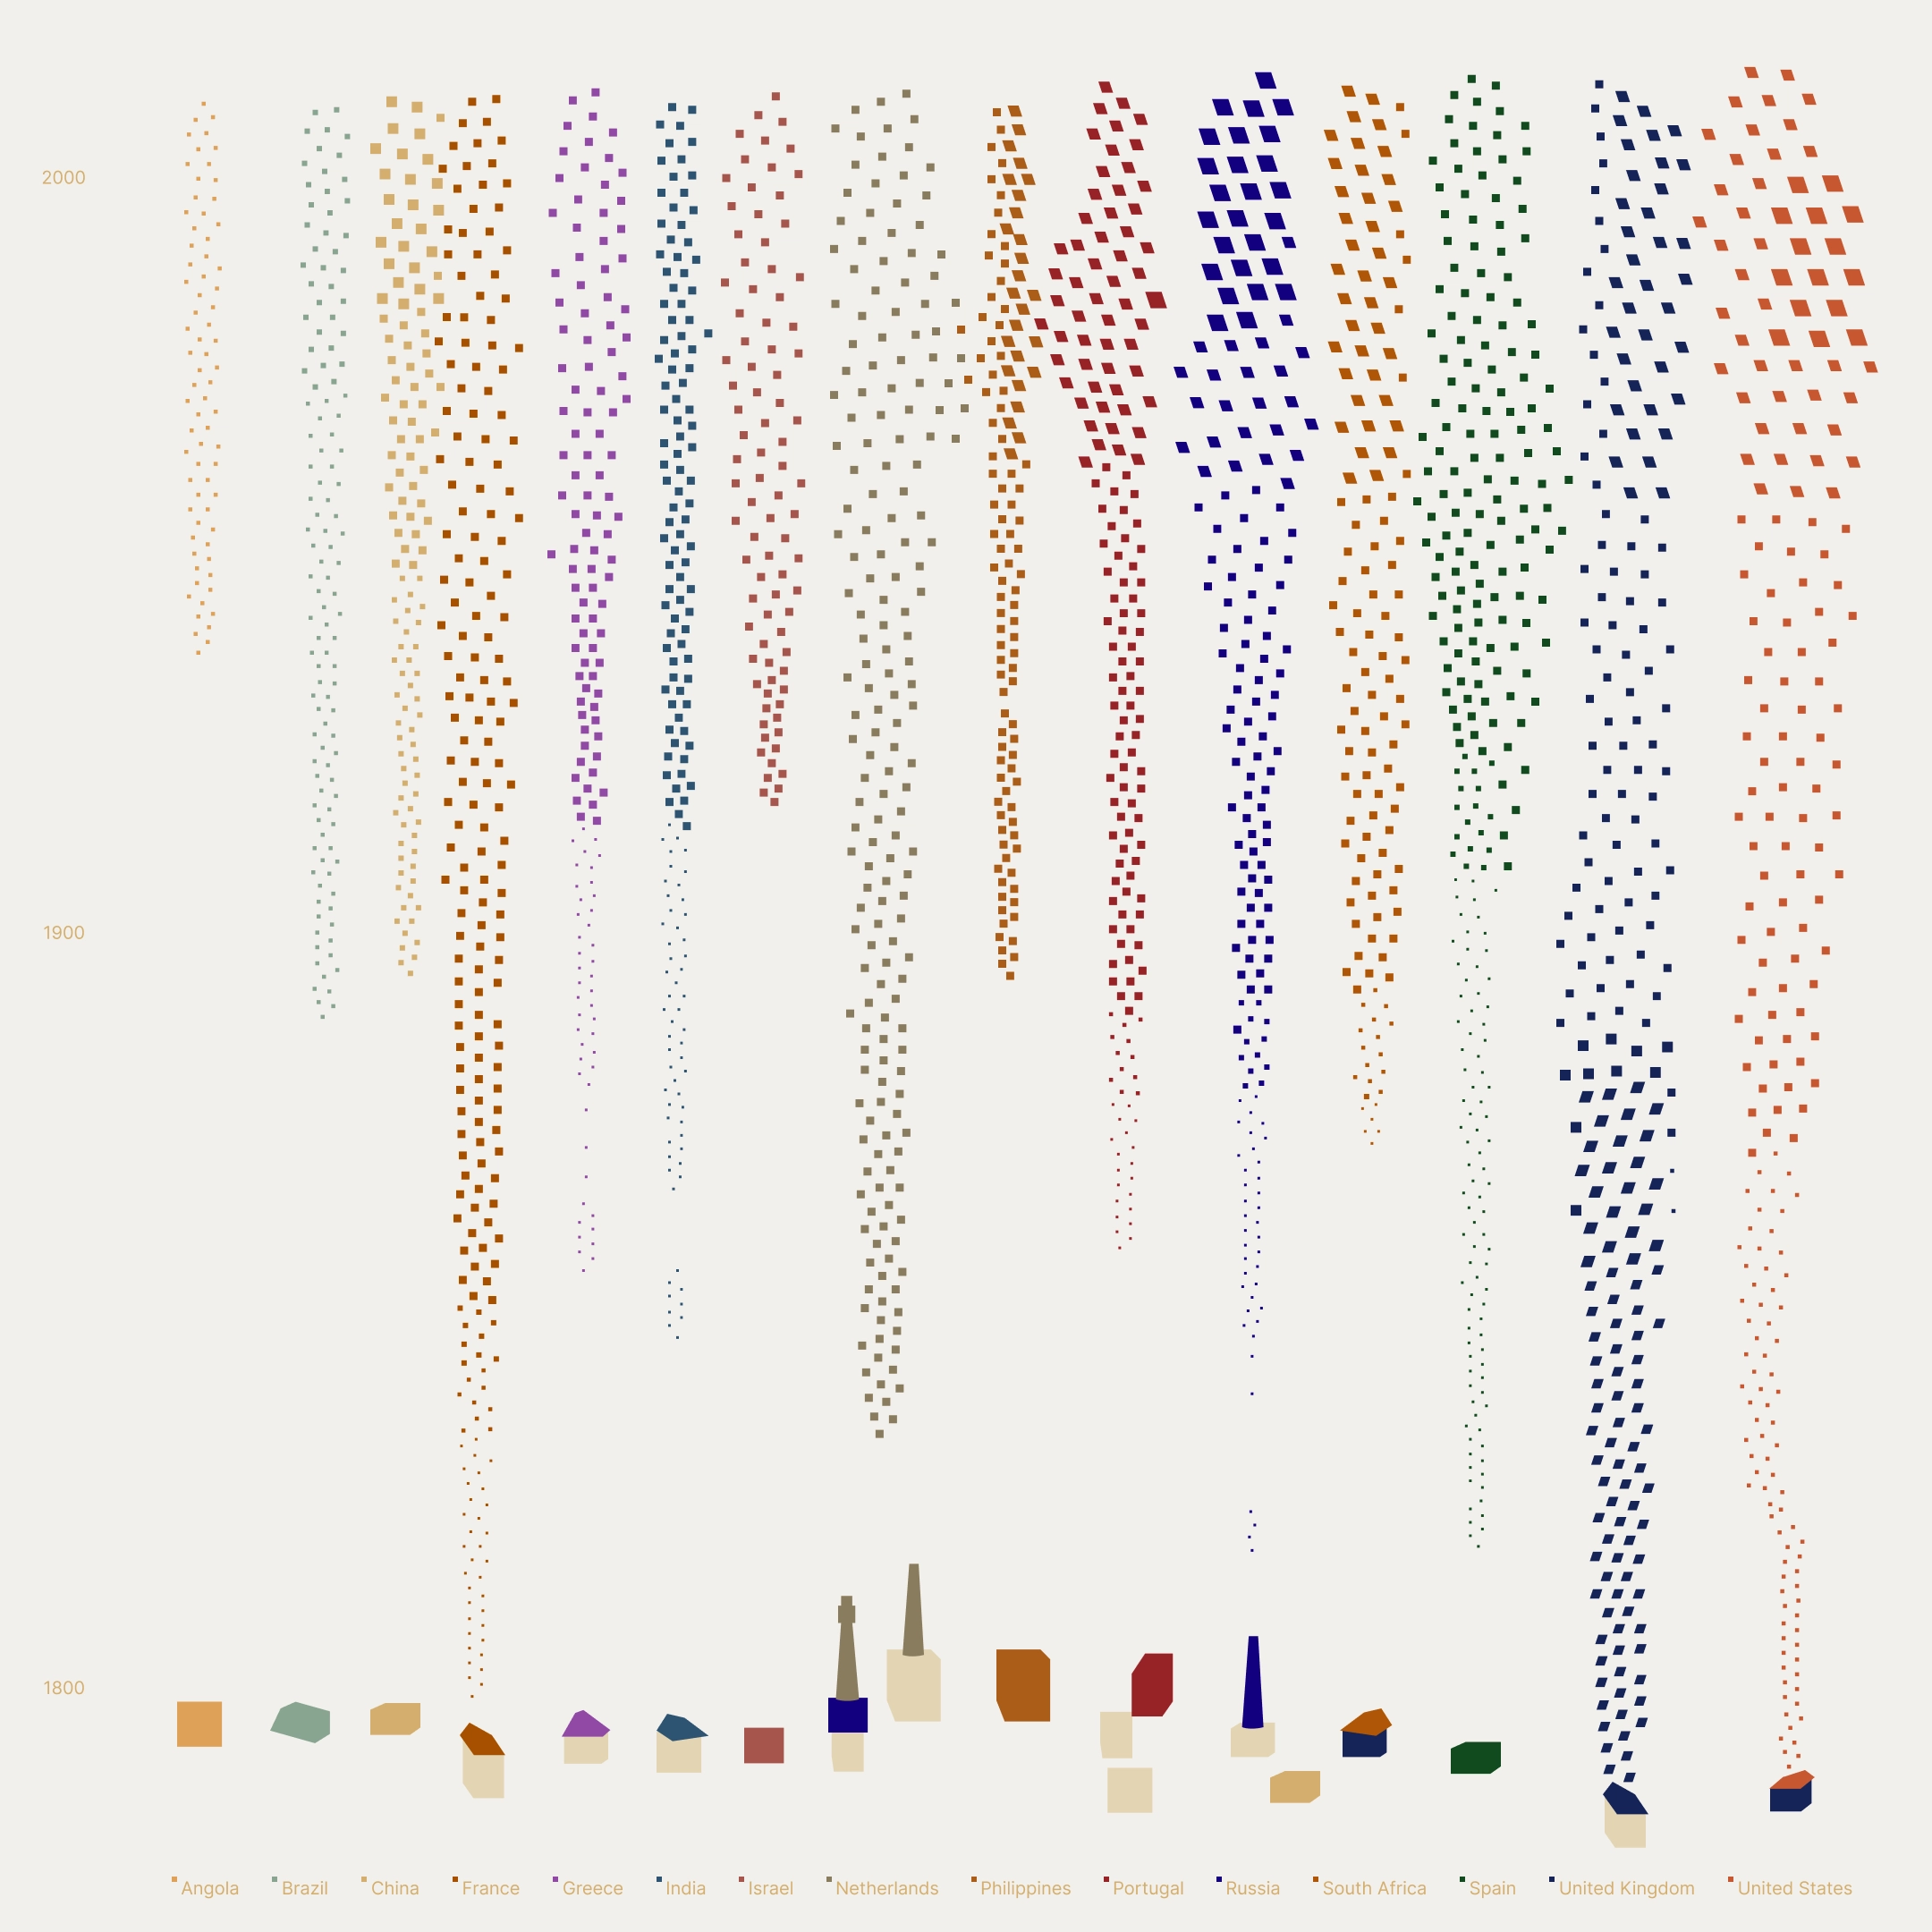
March 2025. I started thinking about different words and I want to visually represent them.
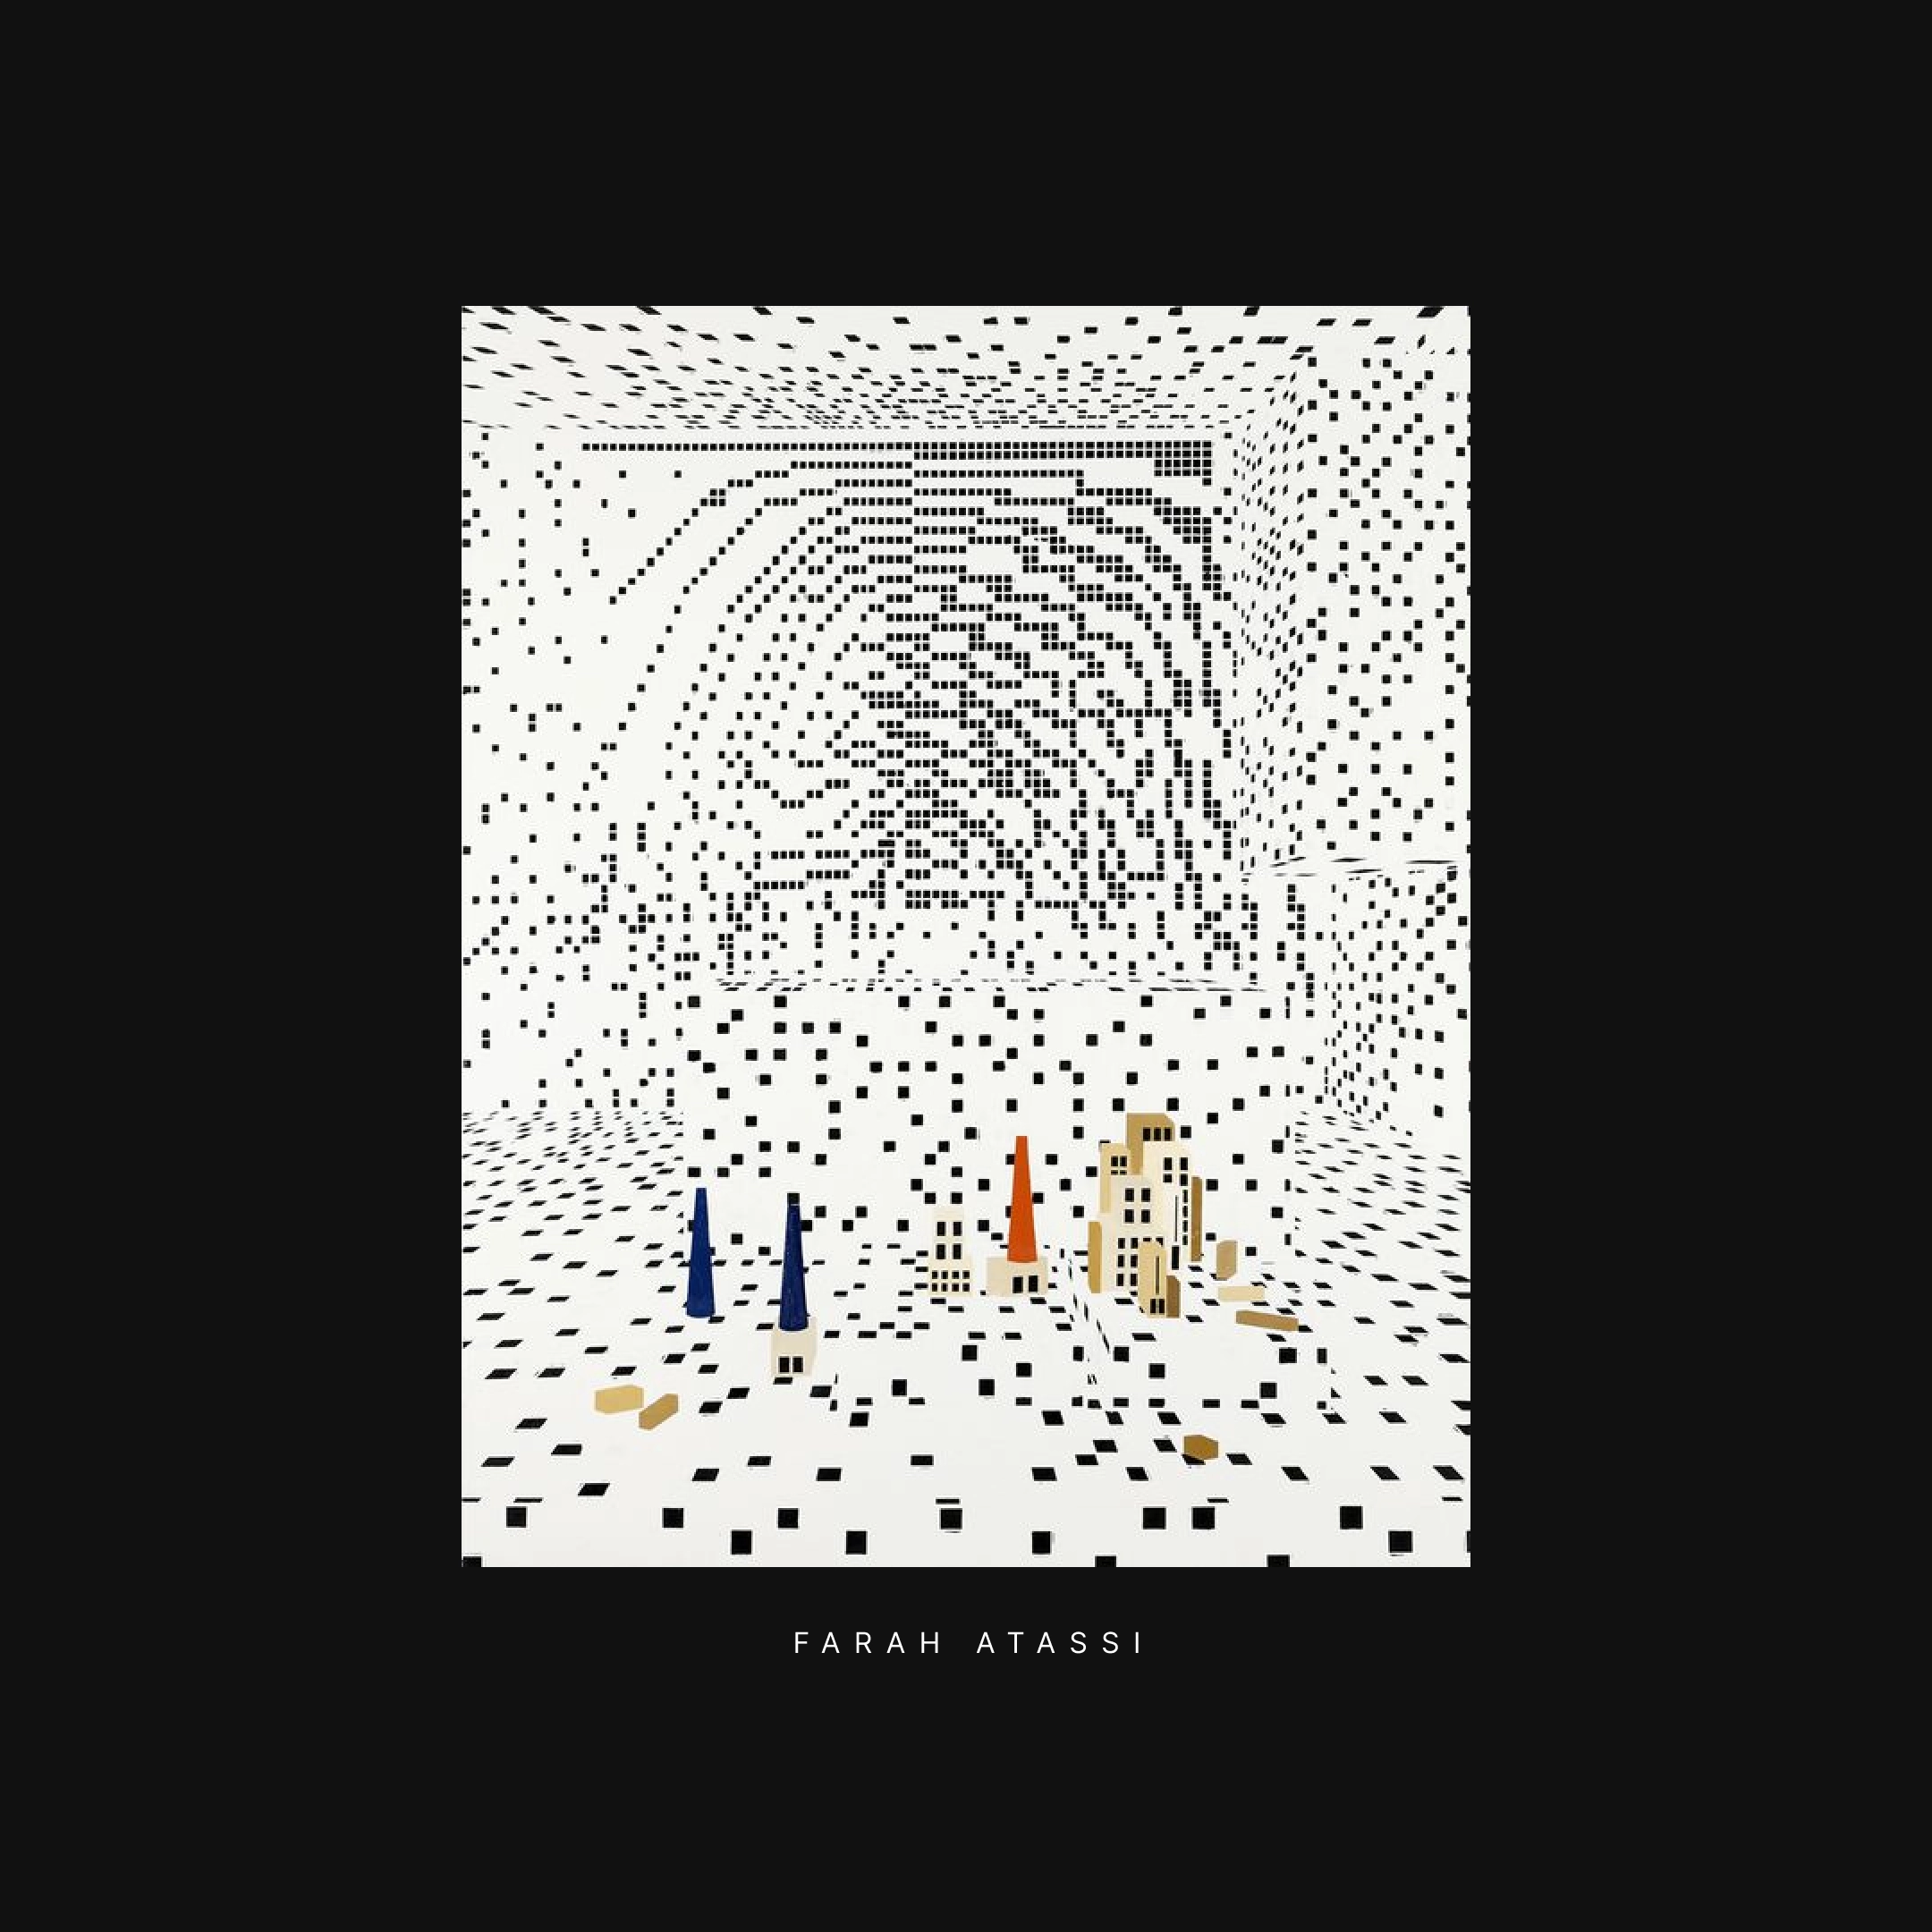
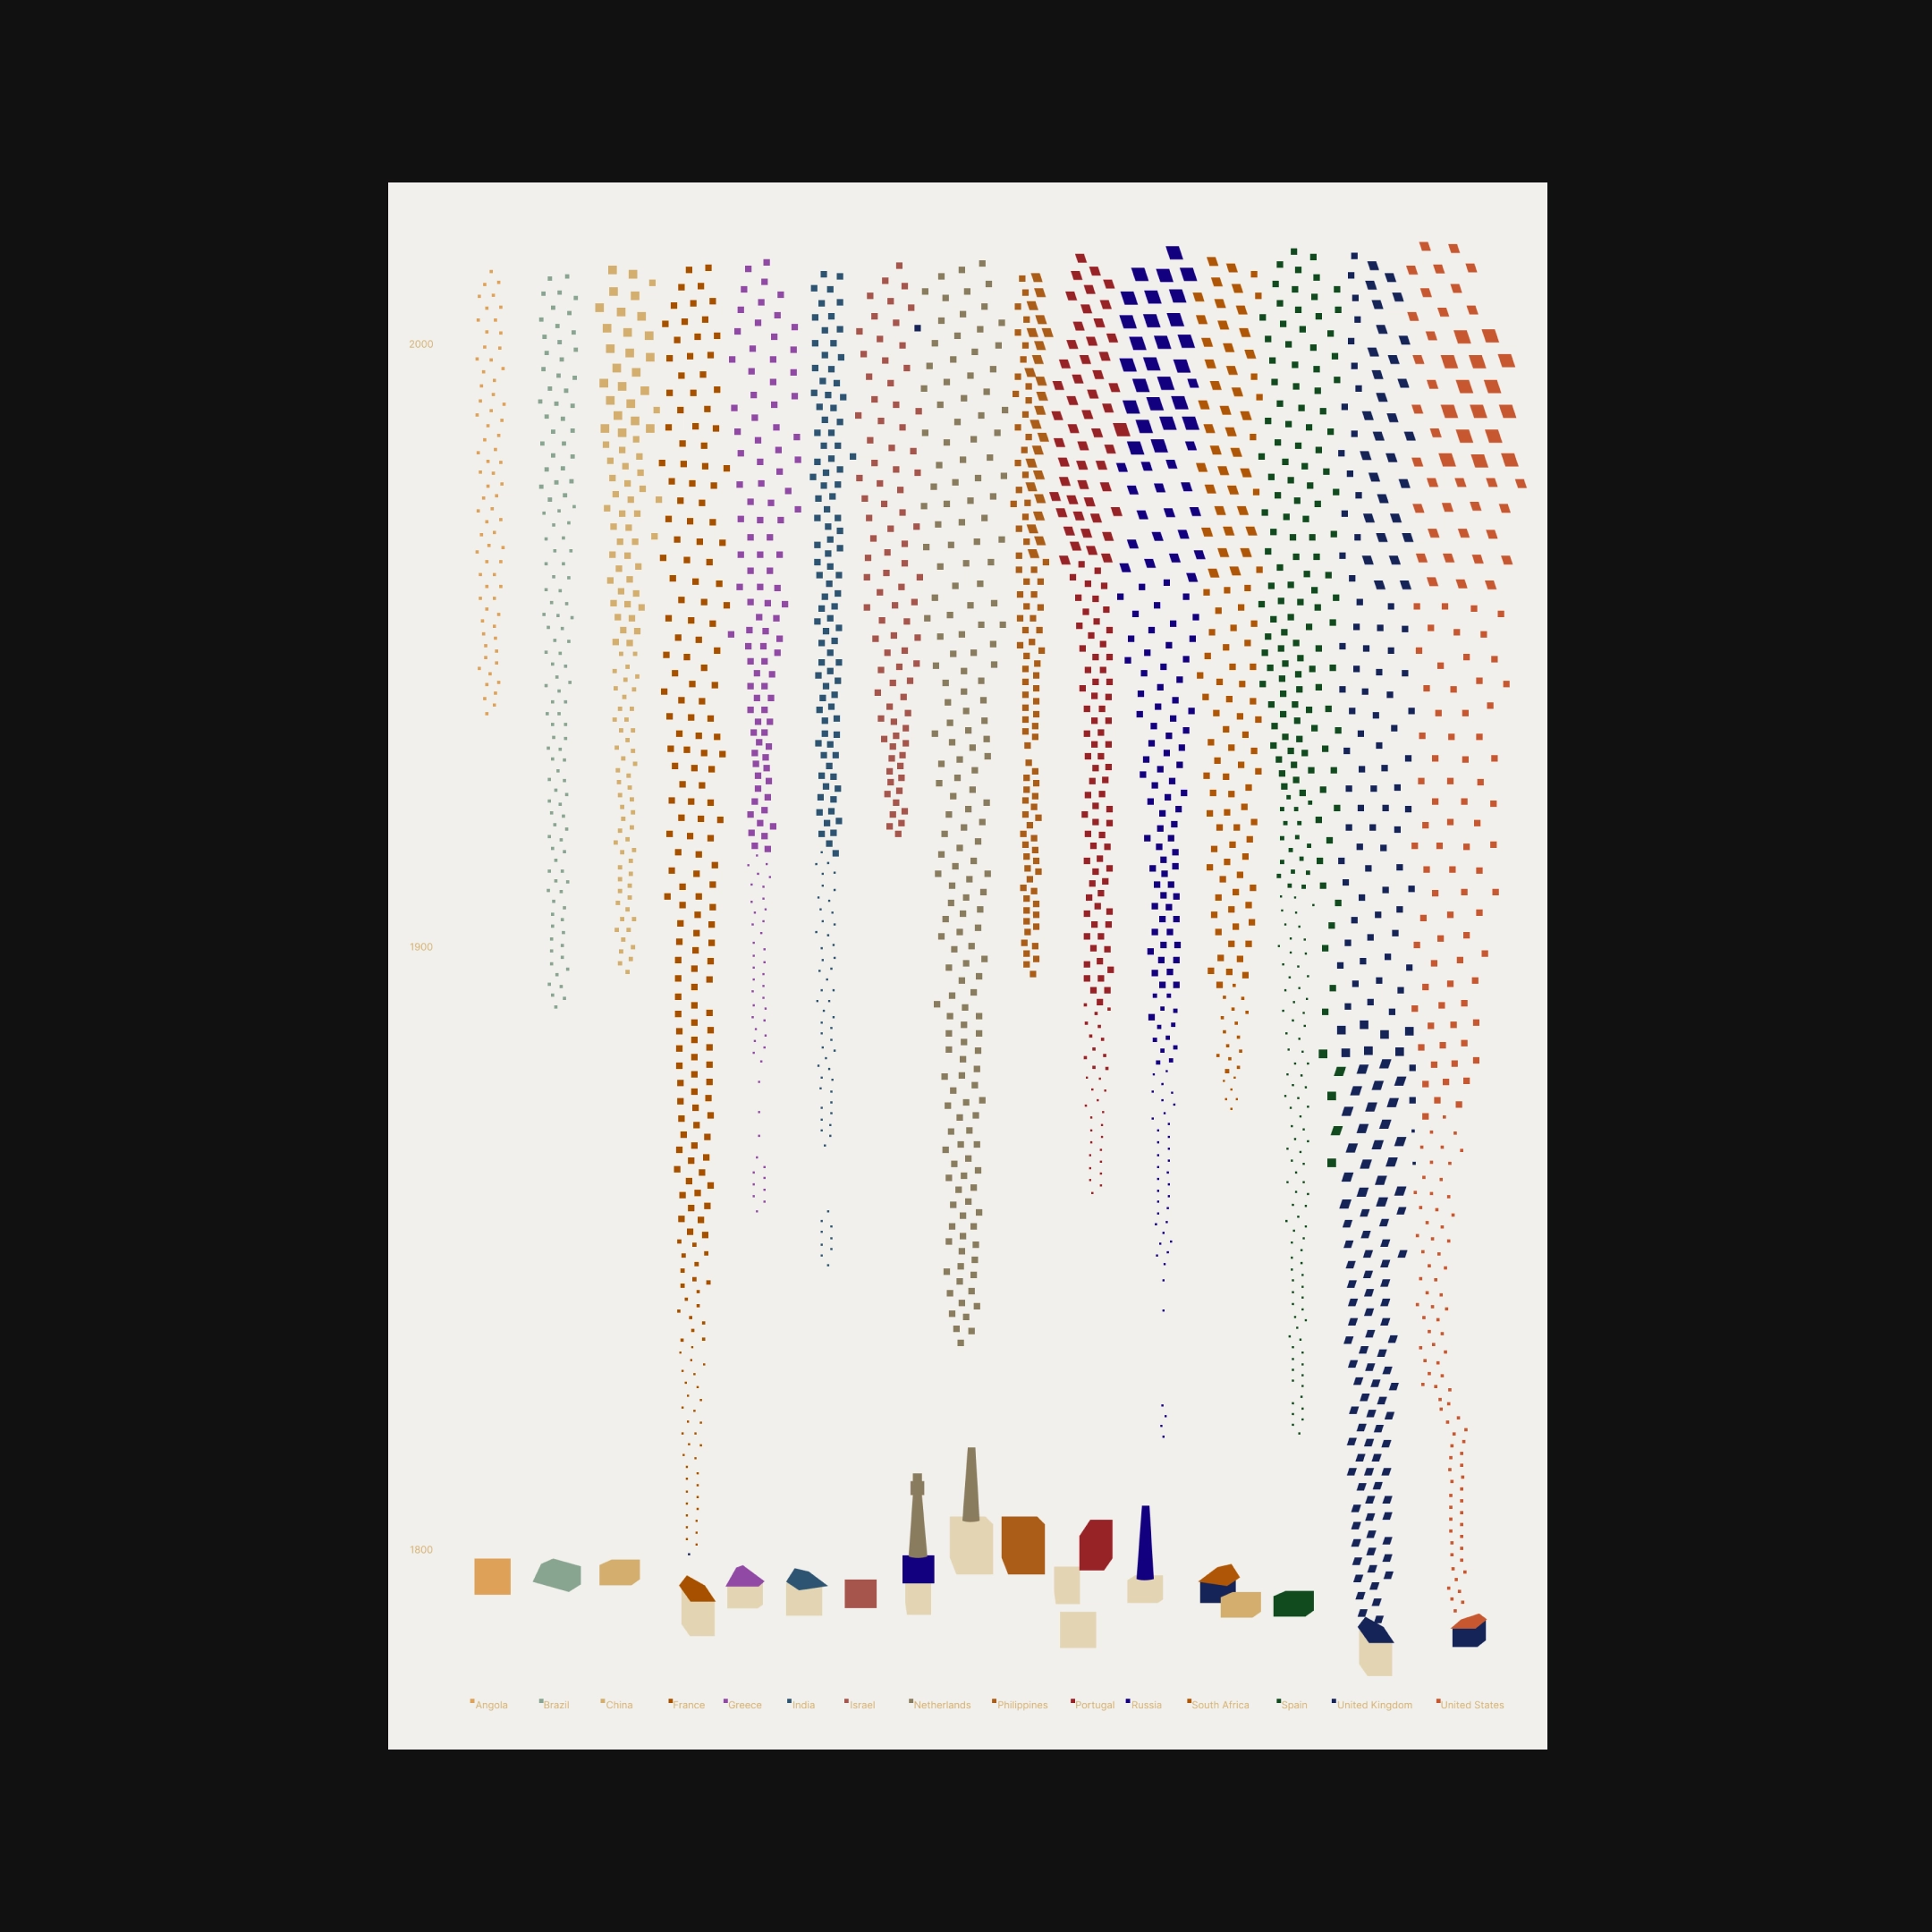
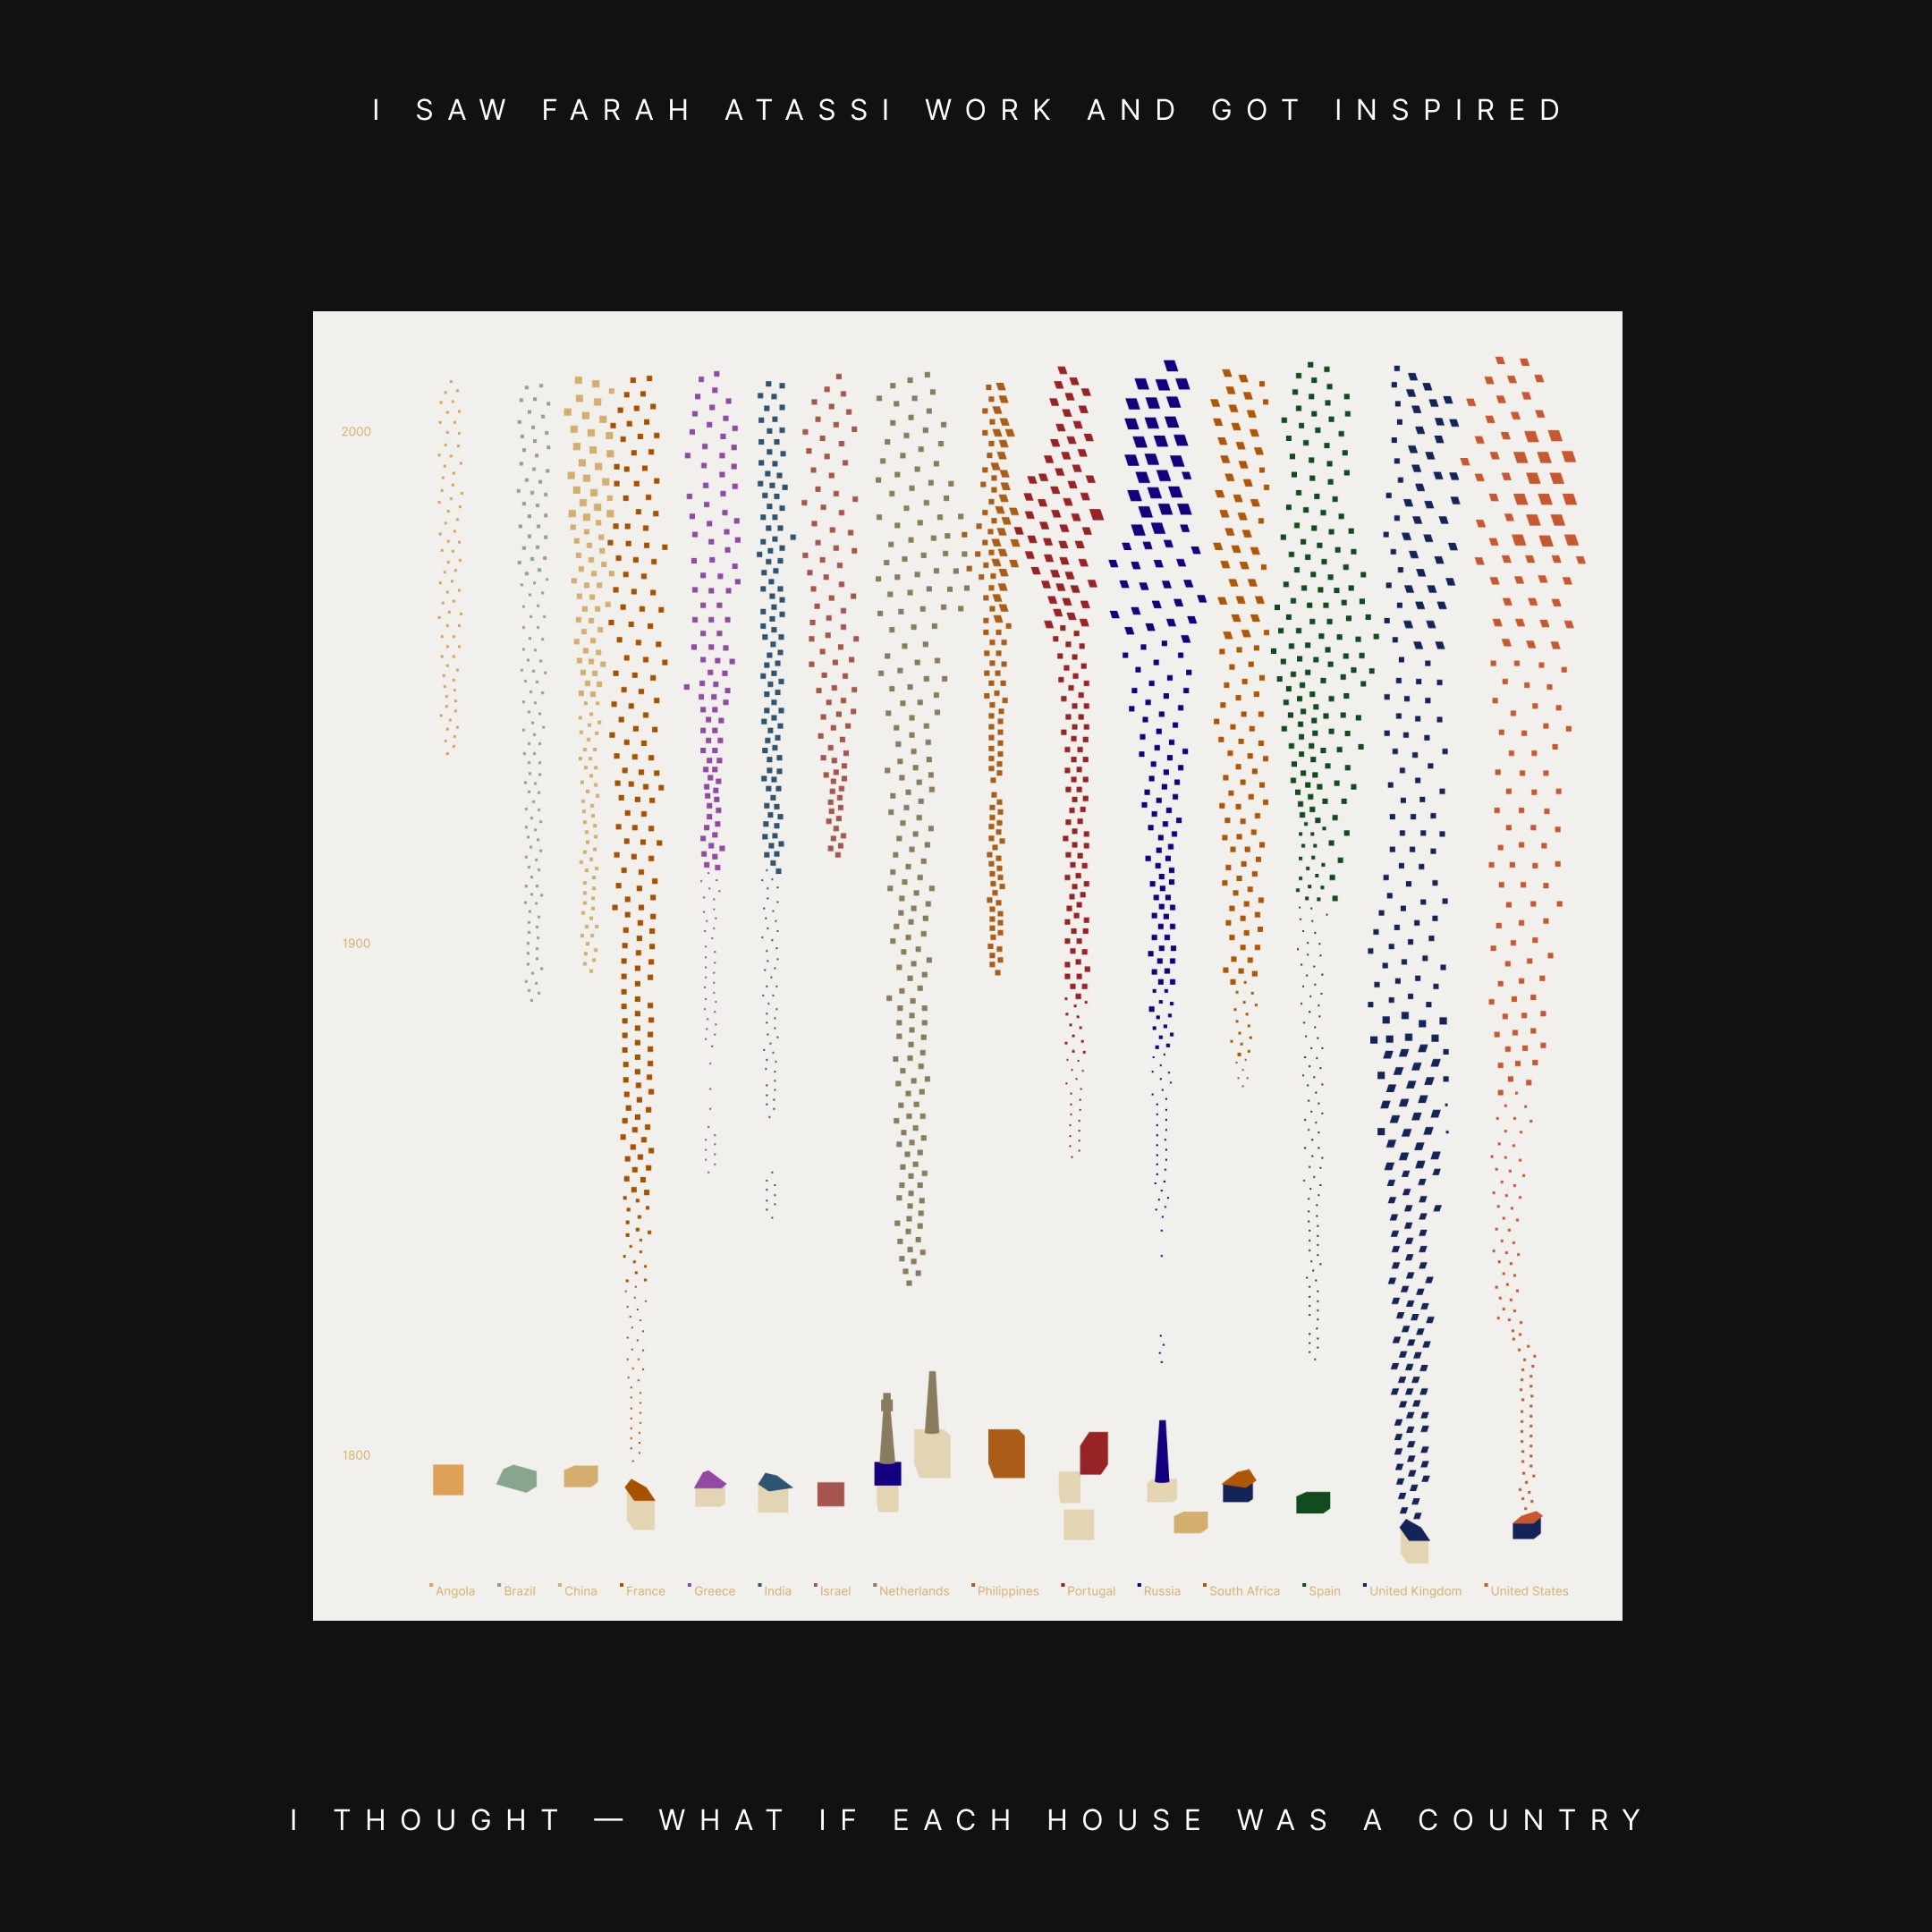
I saw Farah Atassi work and got inspired and thought, what if each house was data of a country.
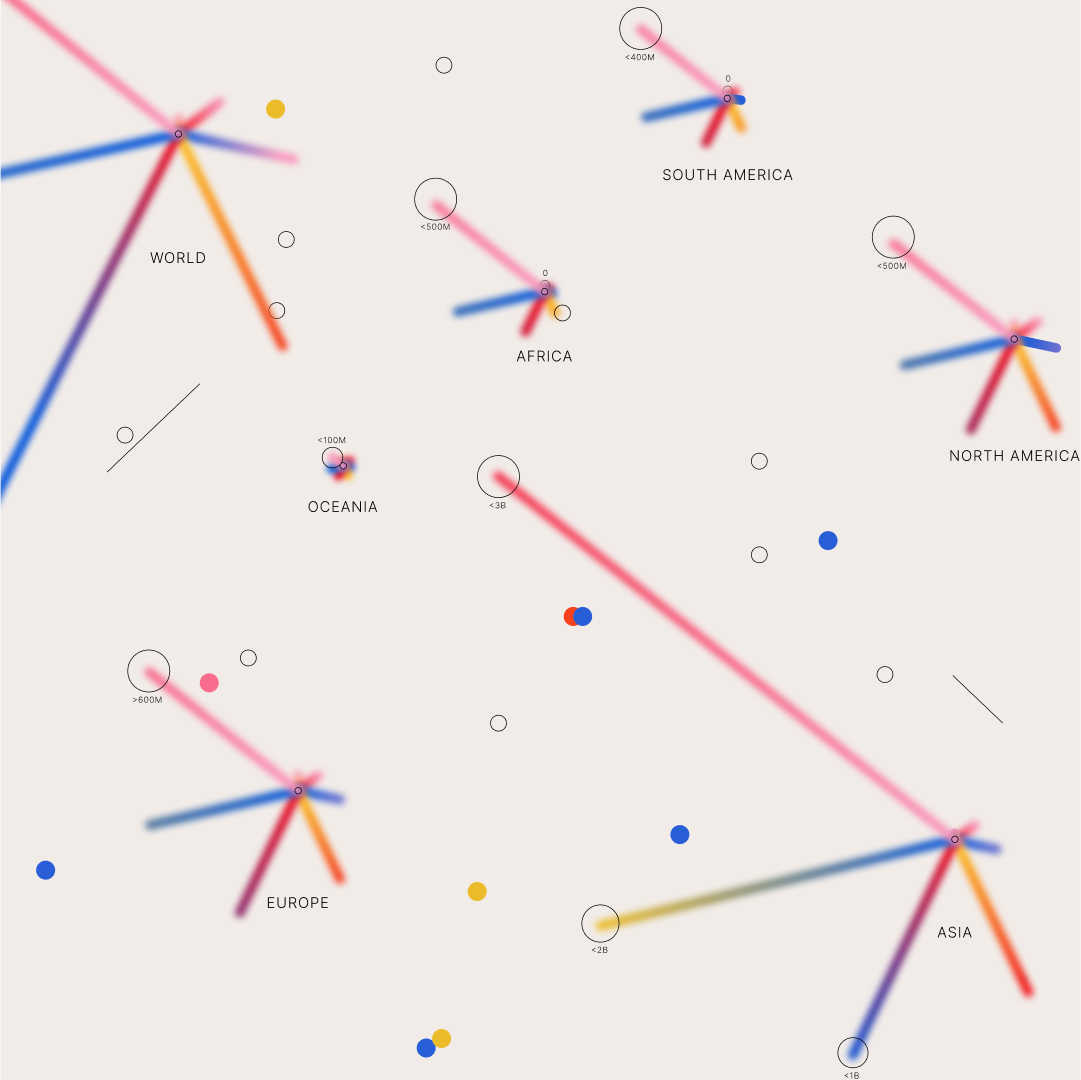
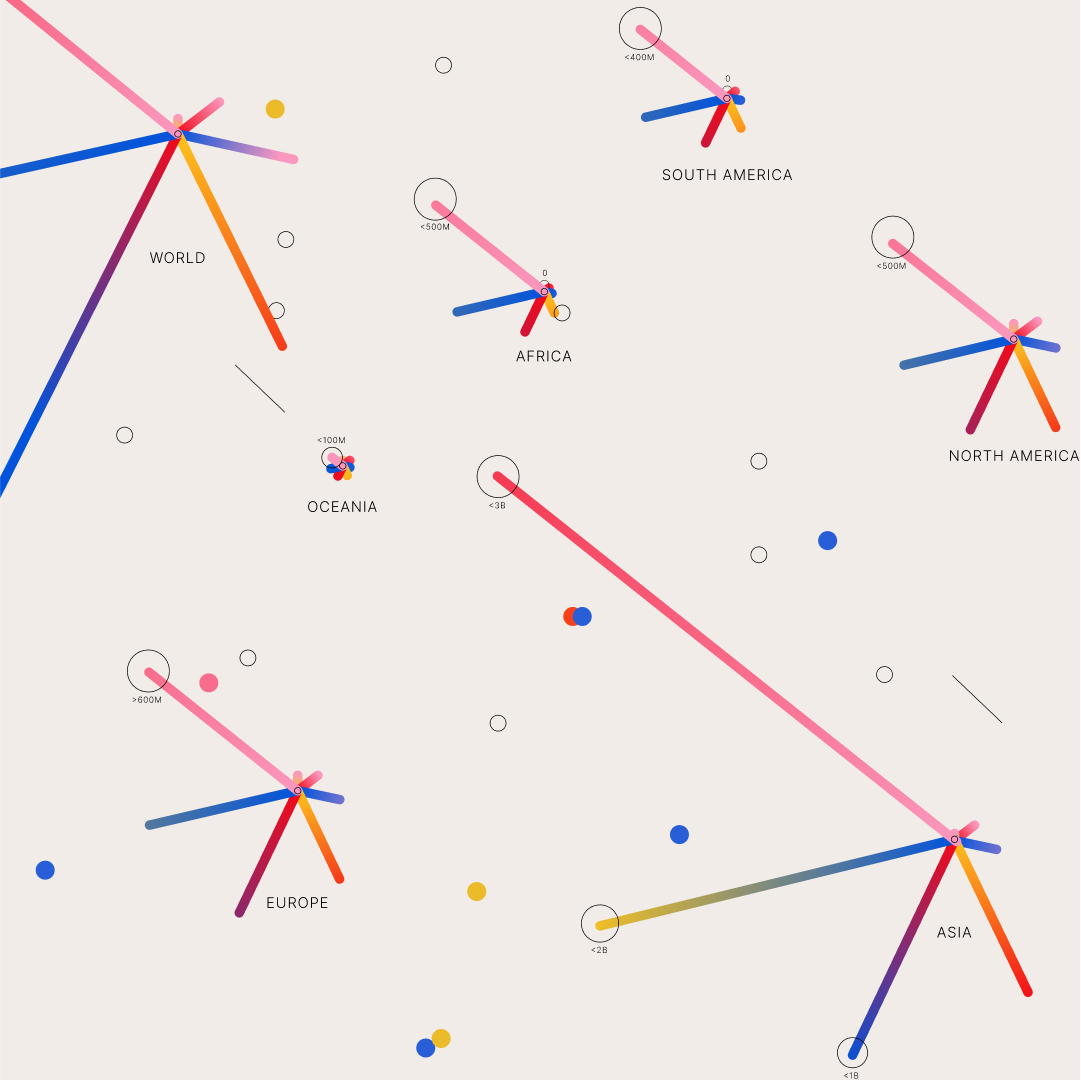
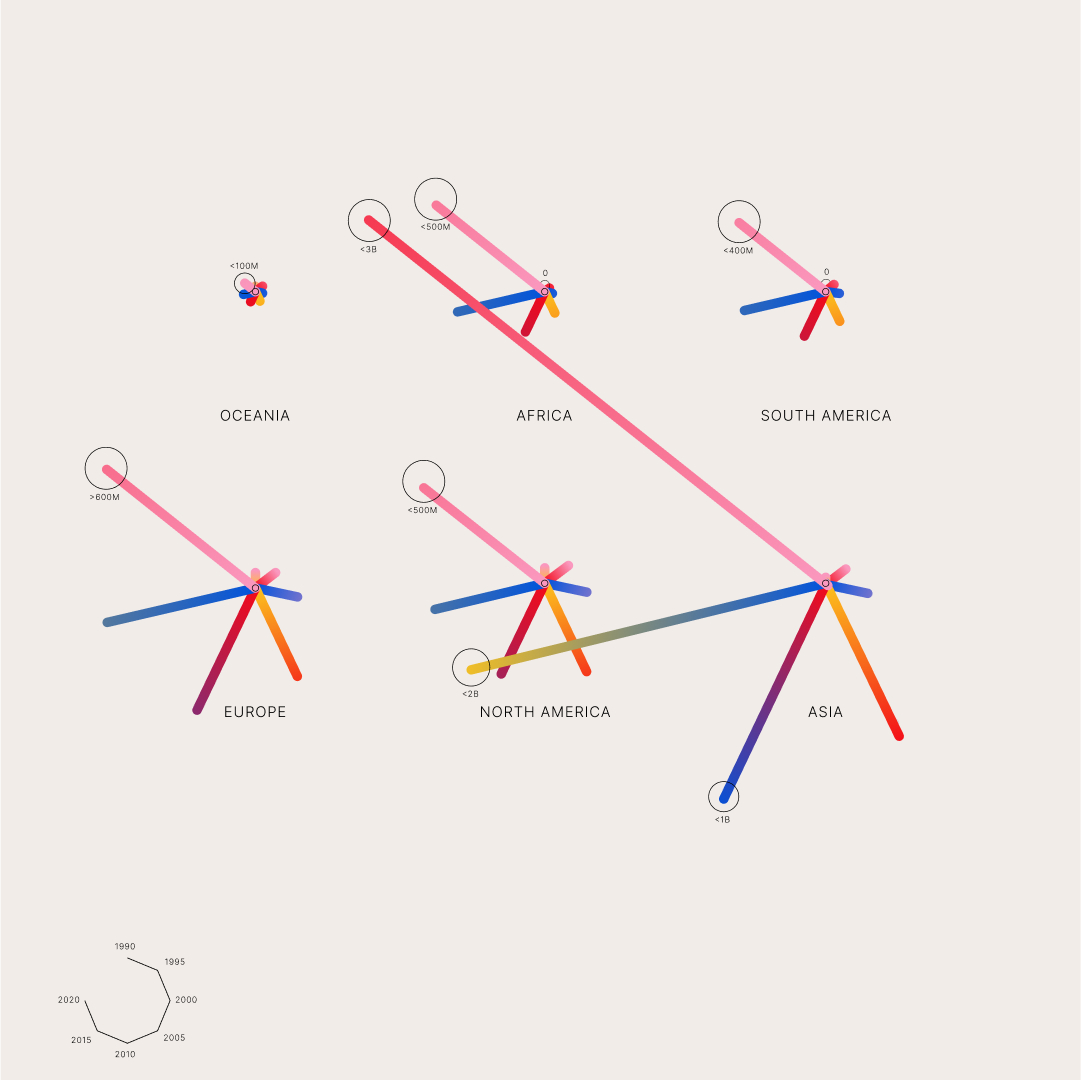
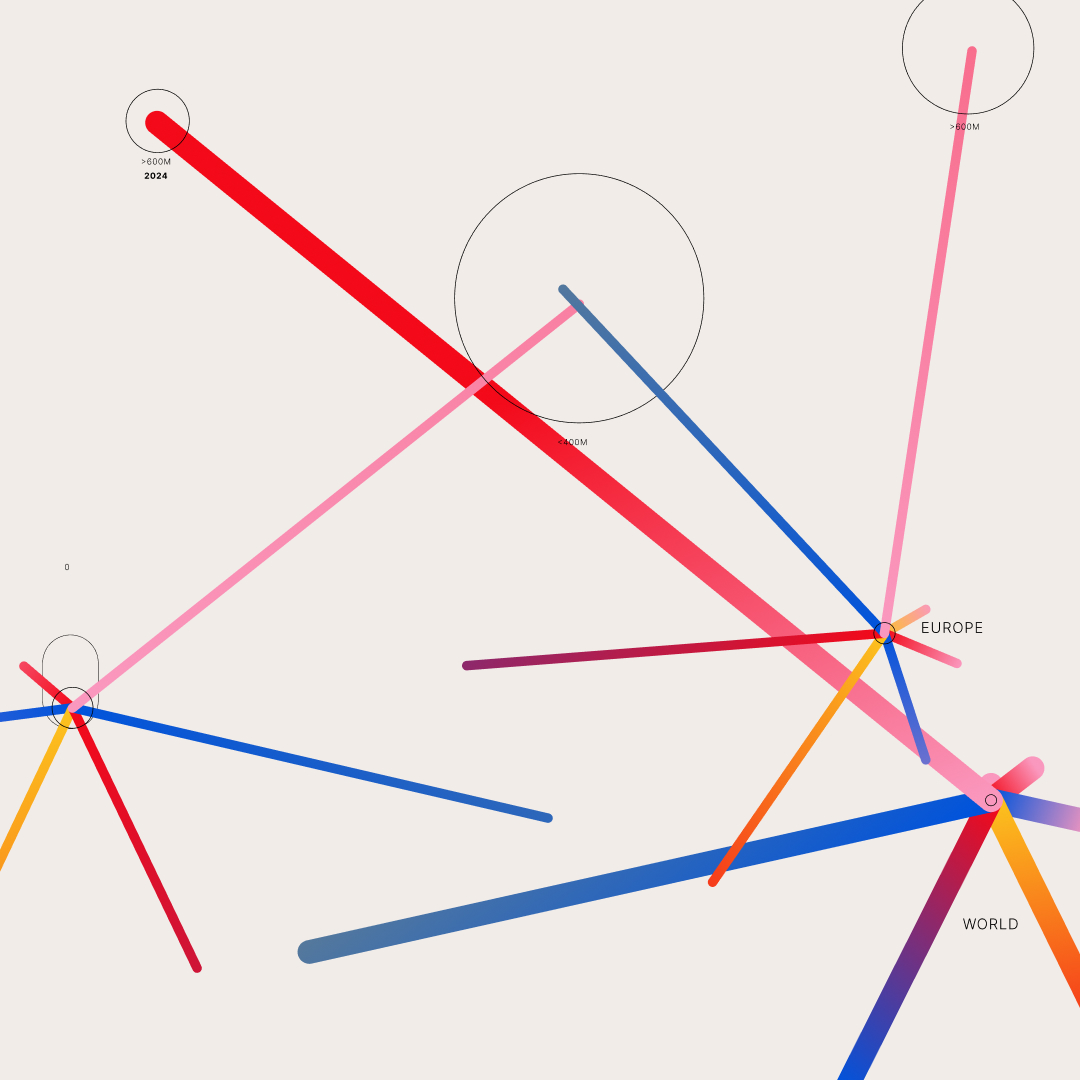
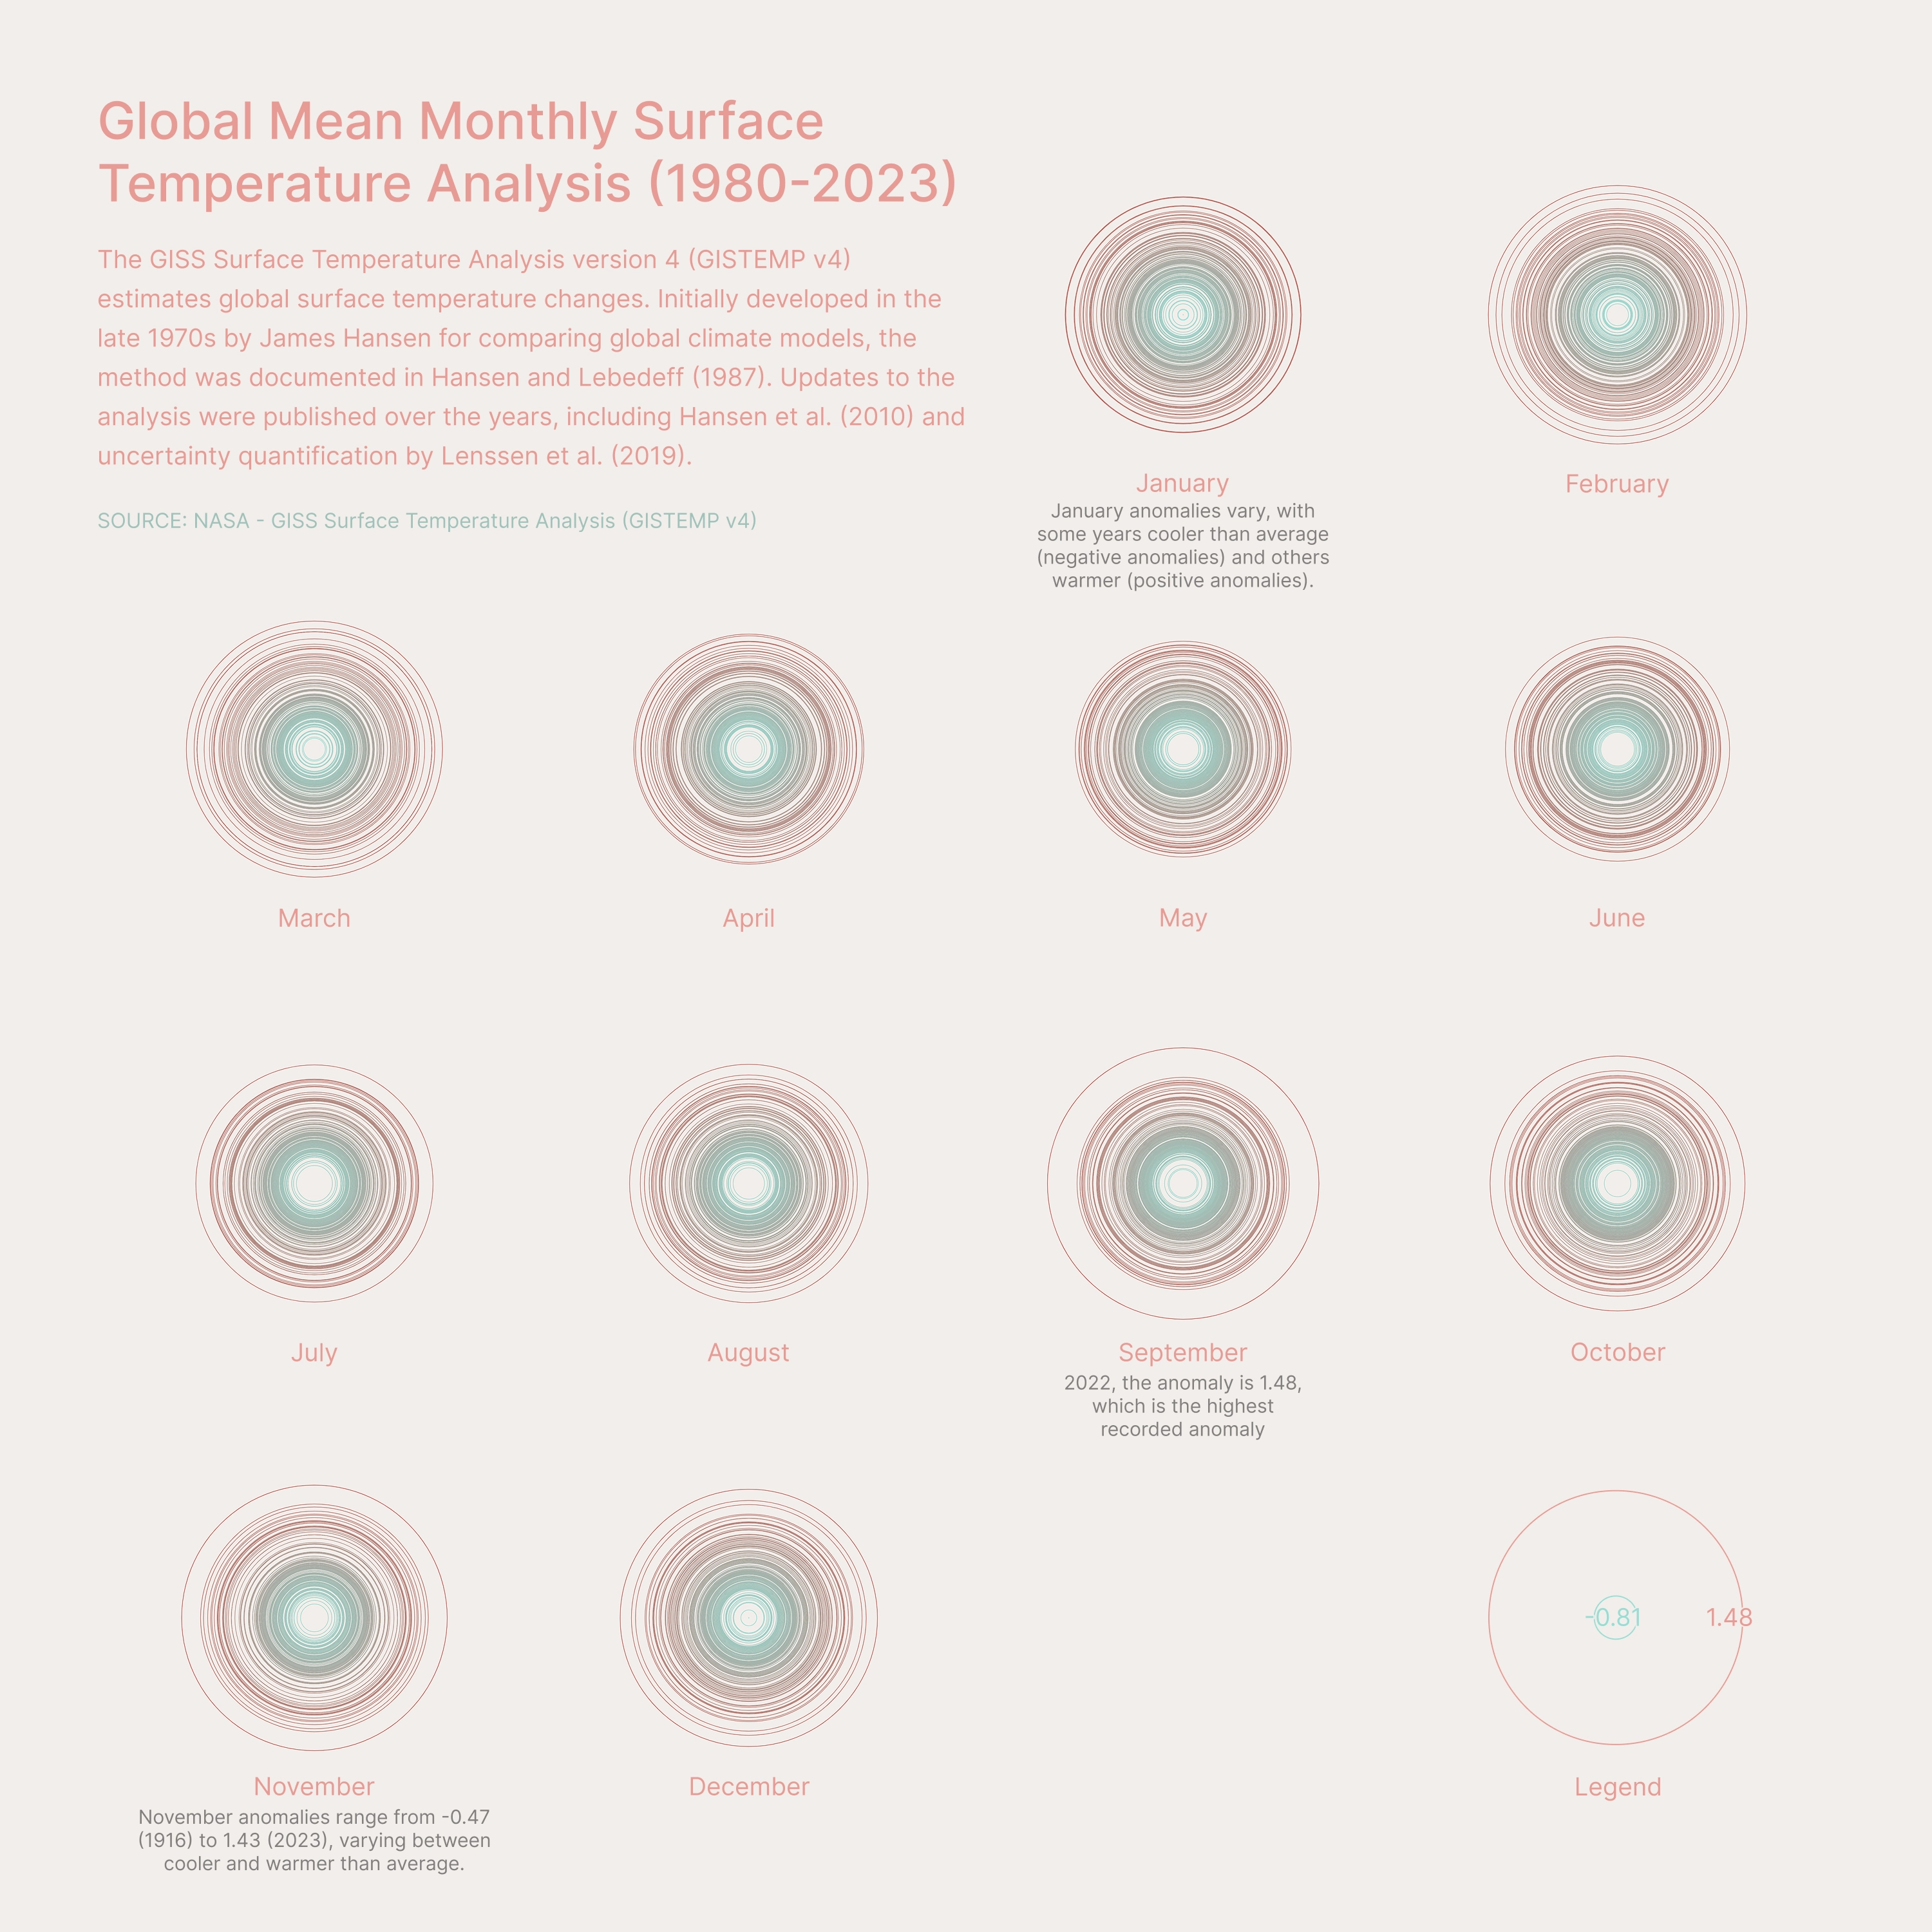
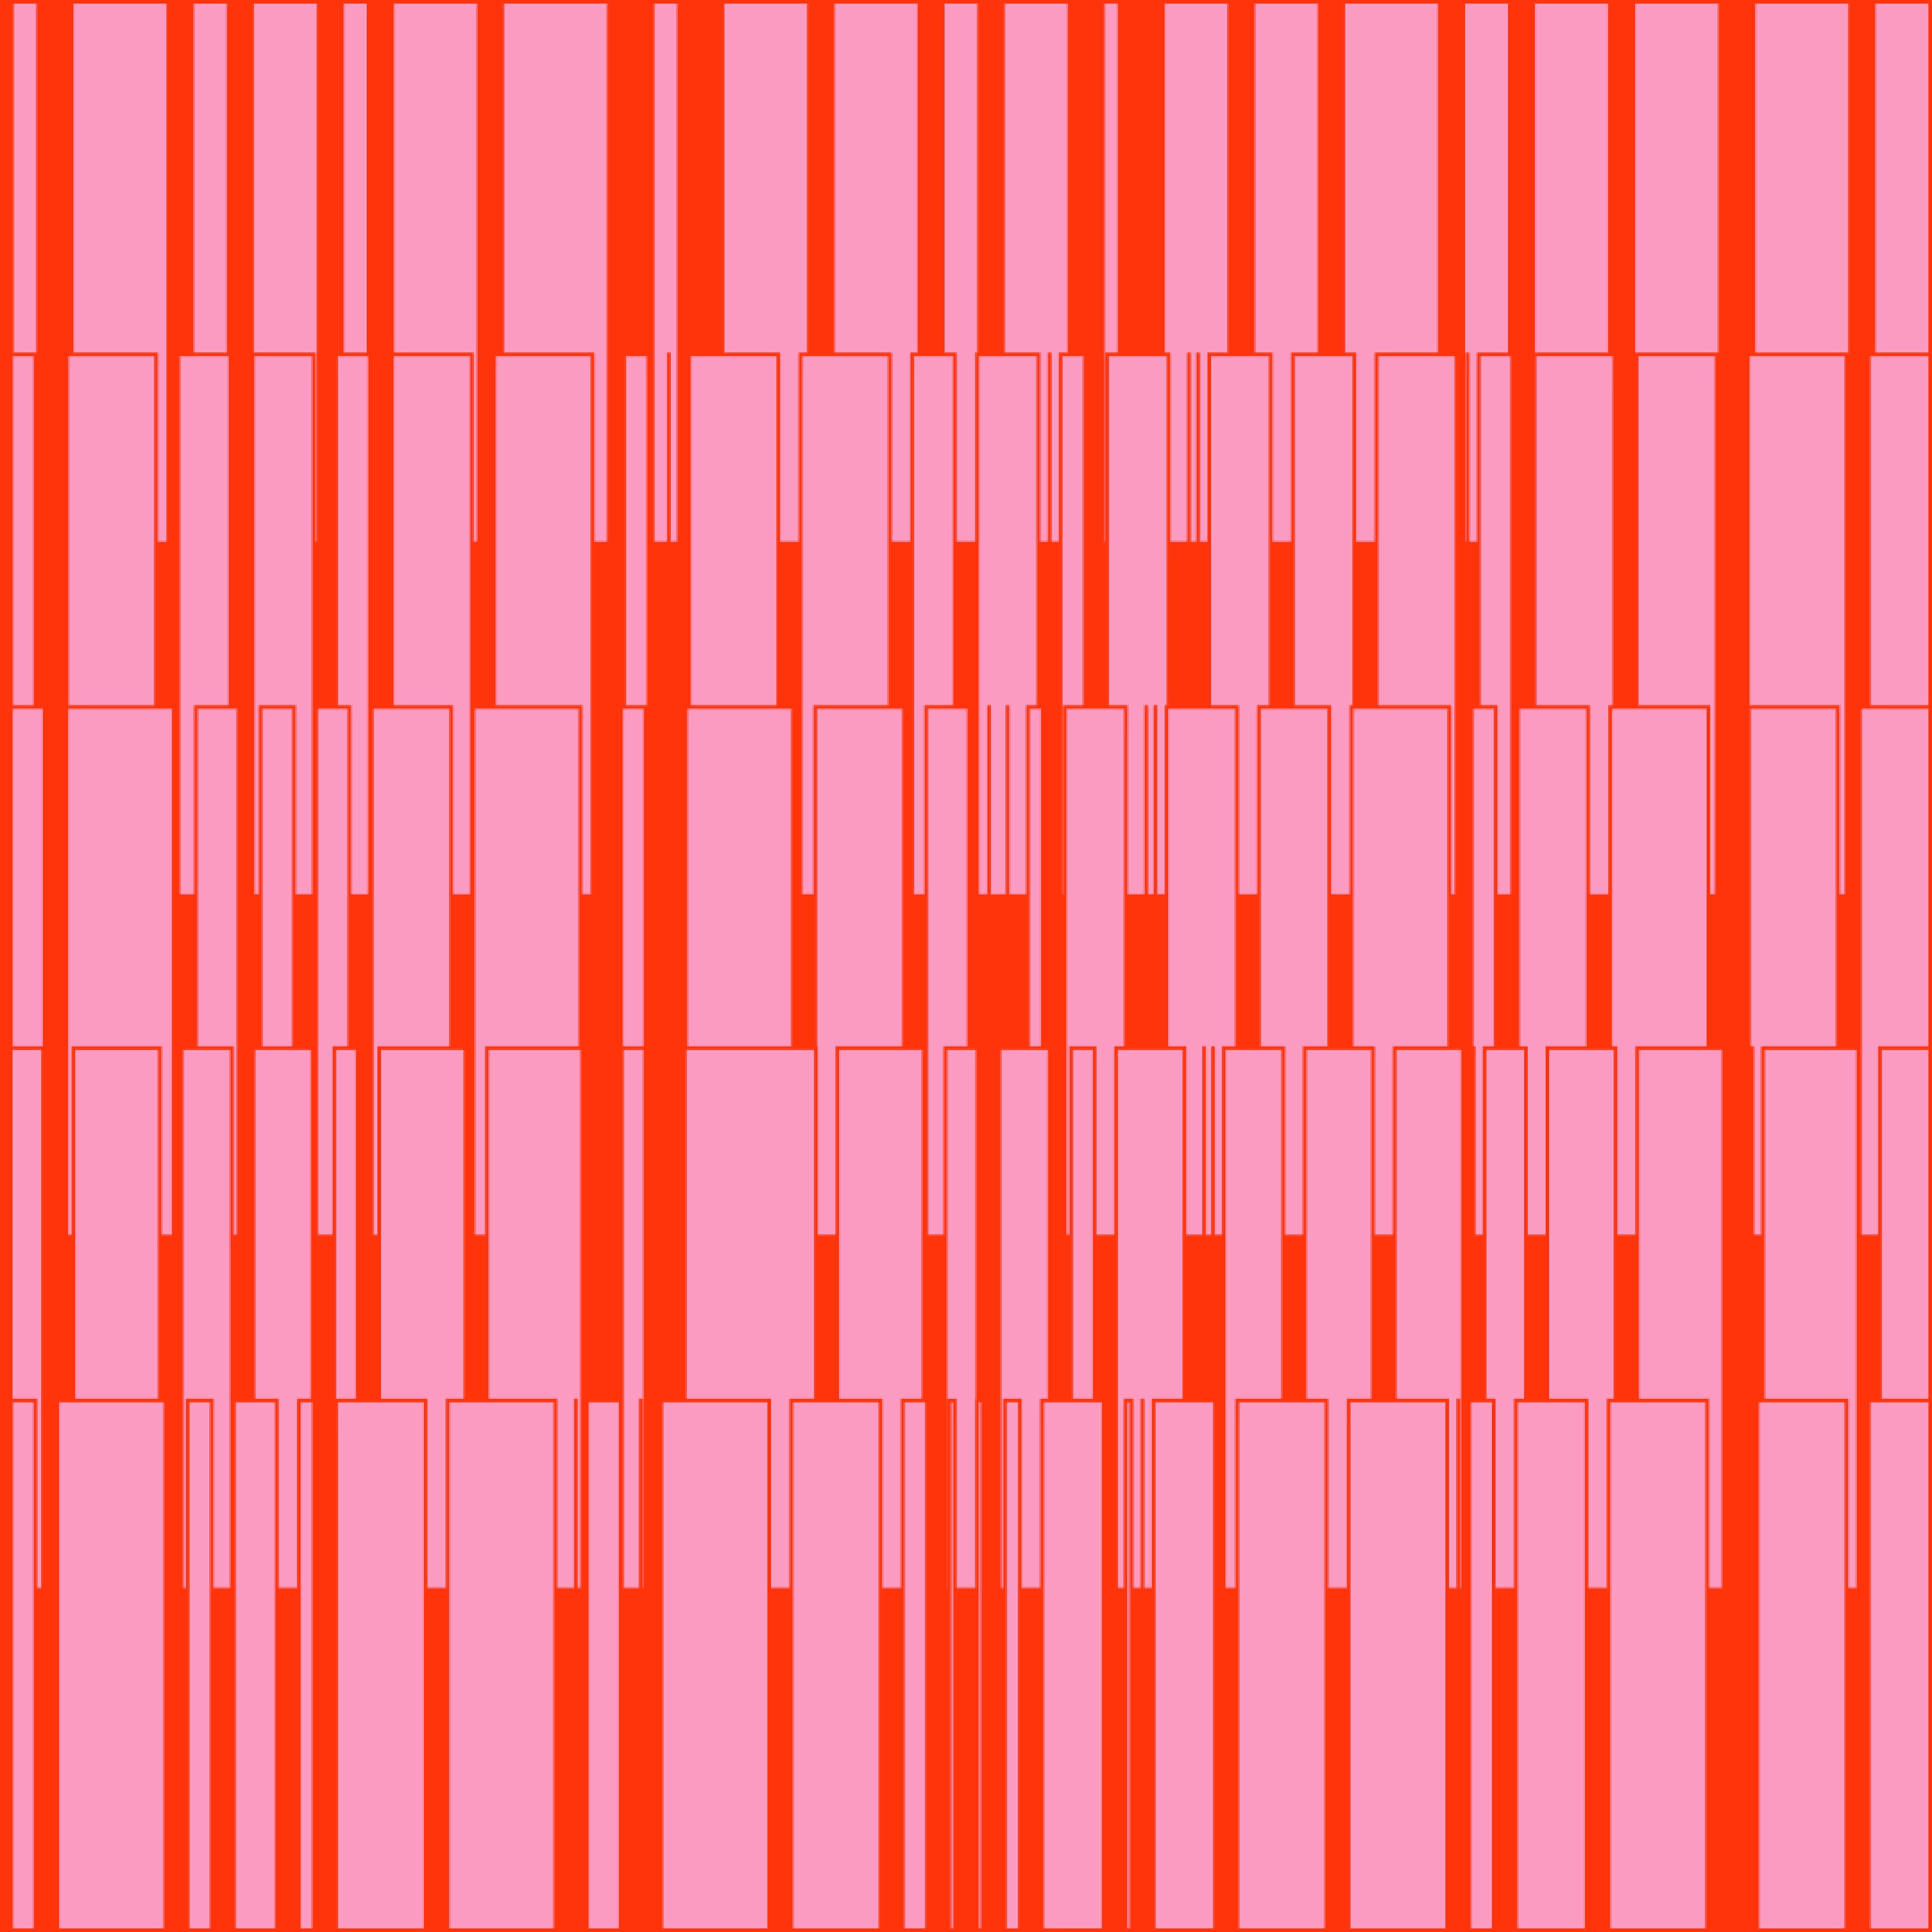
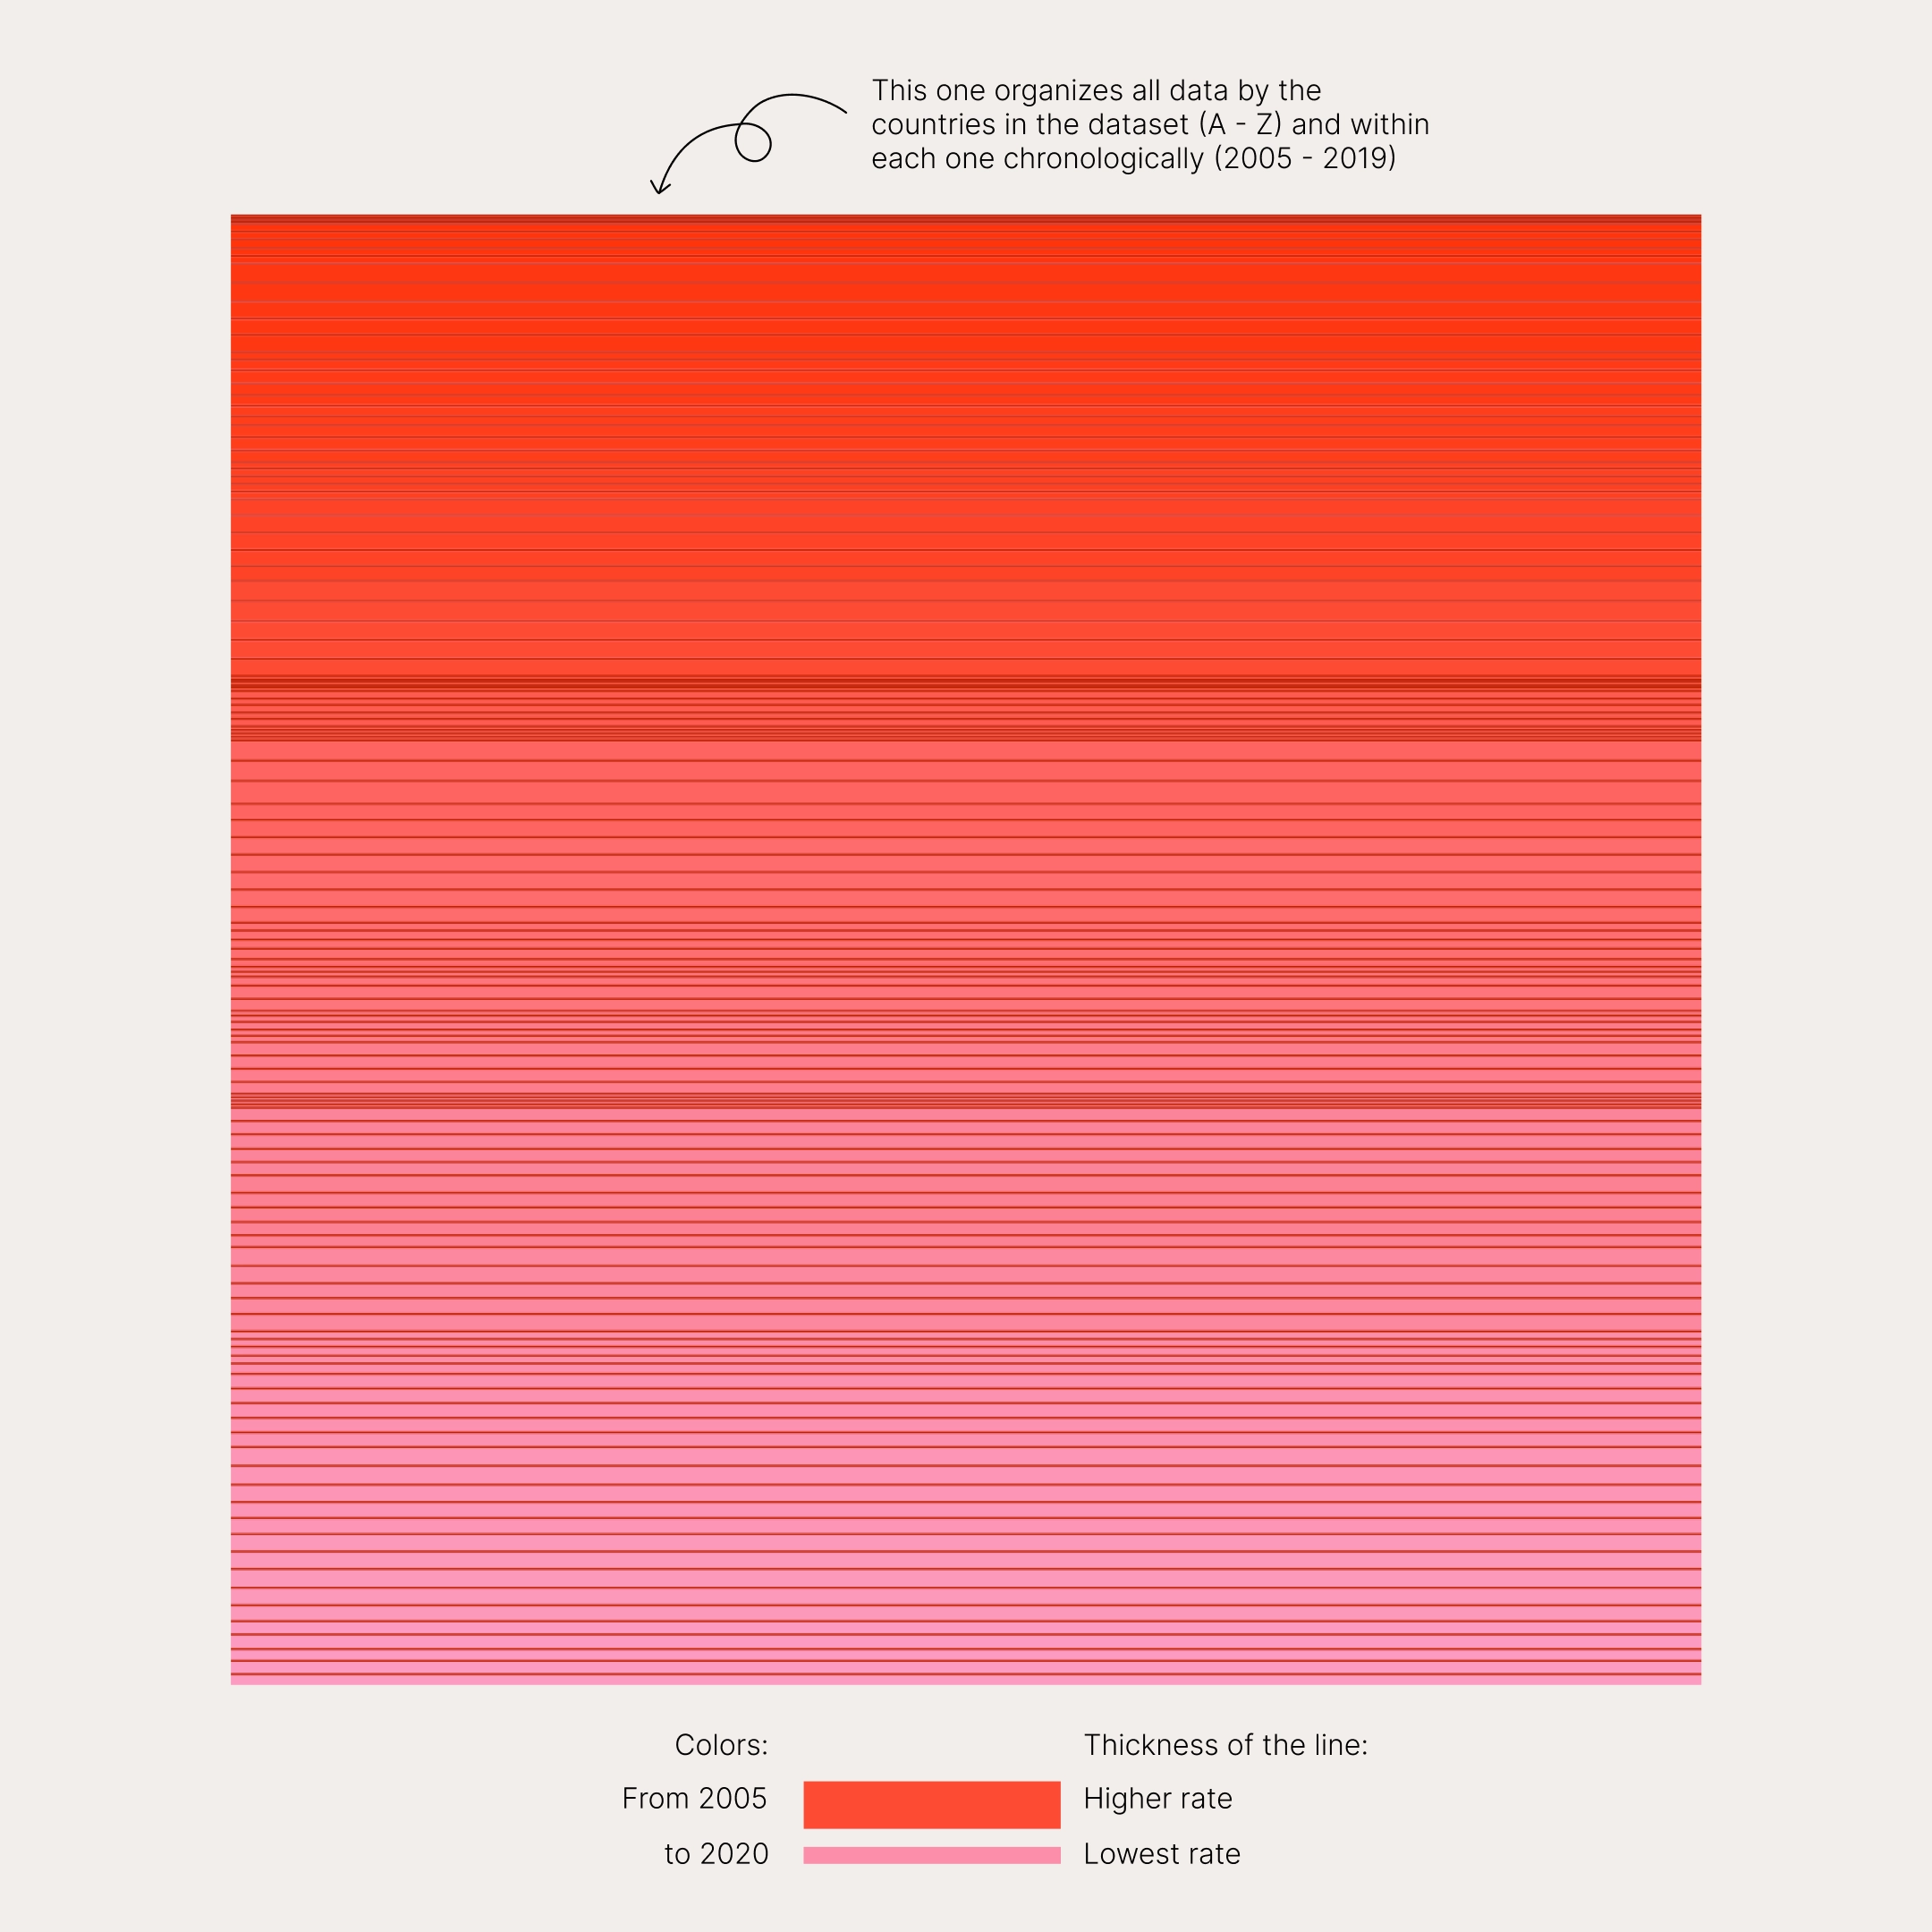
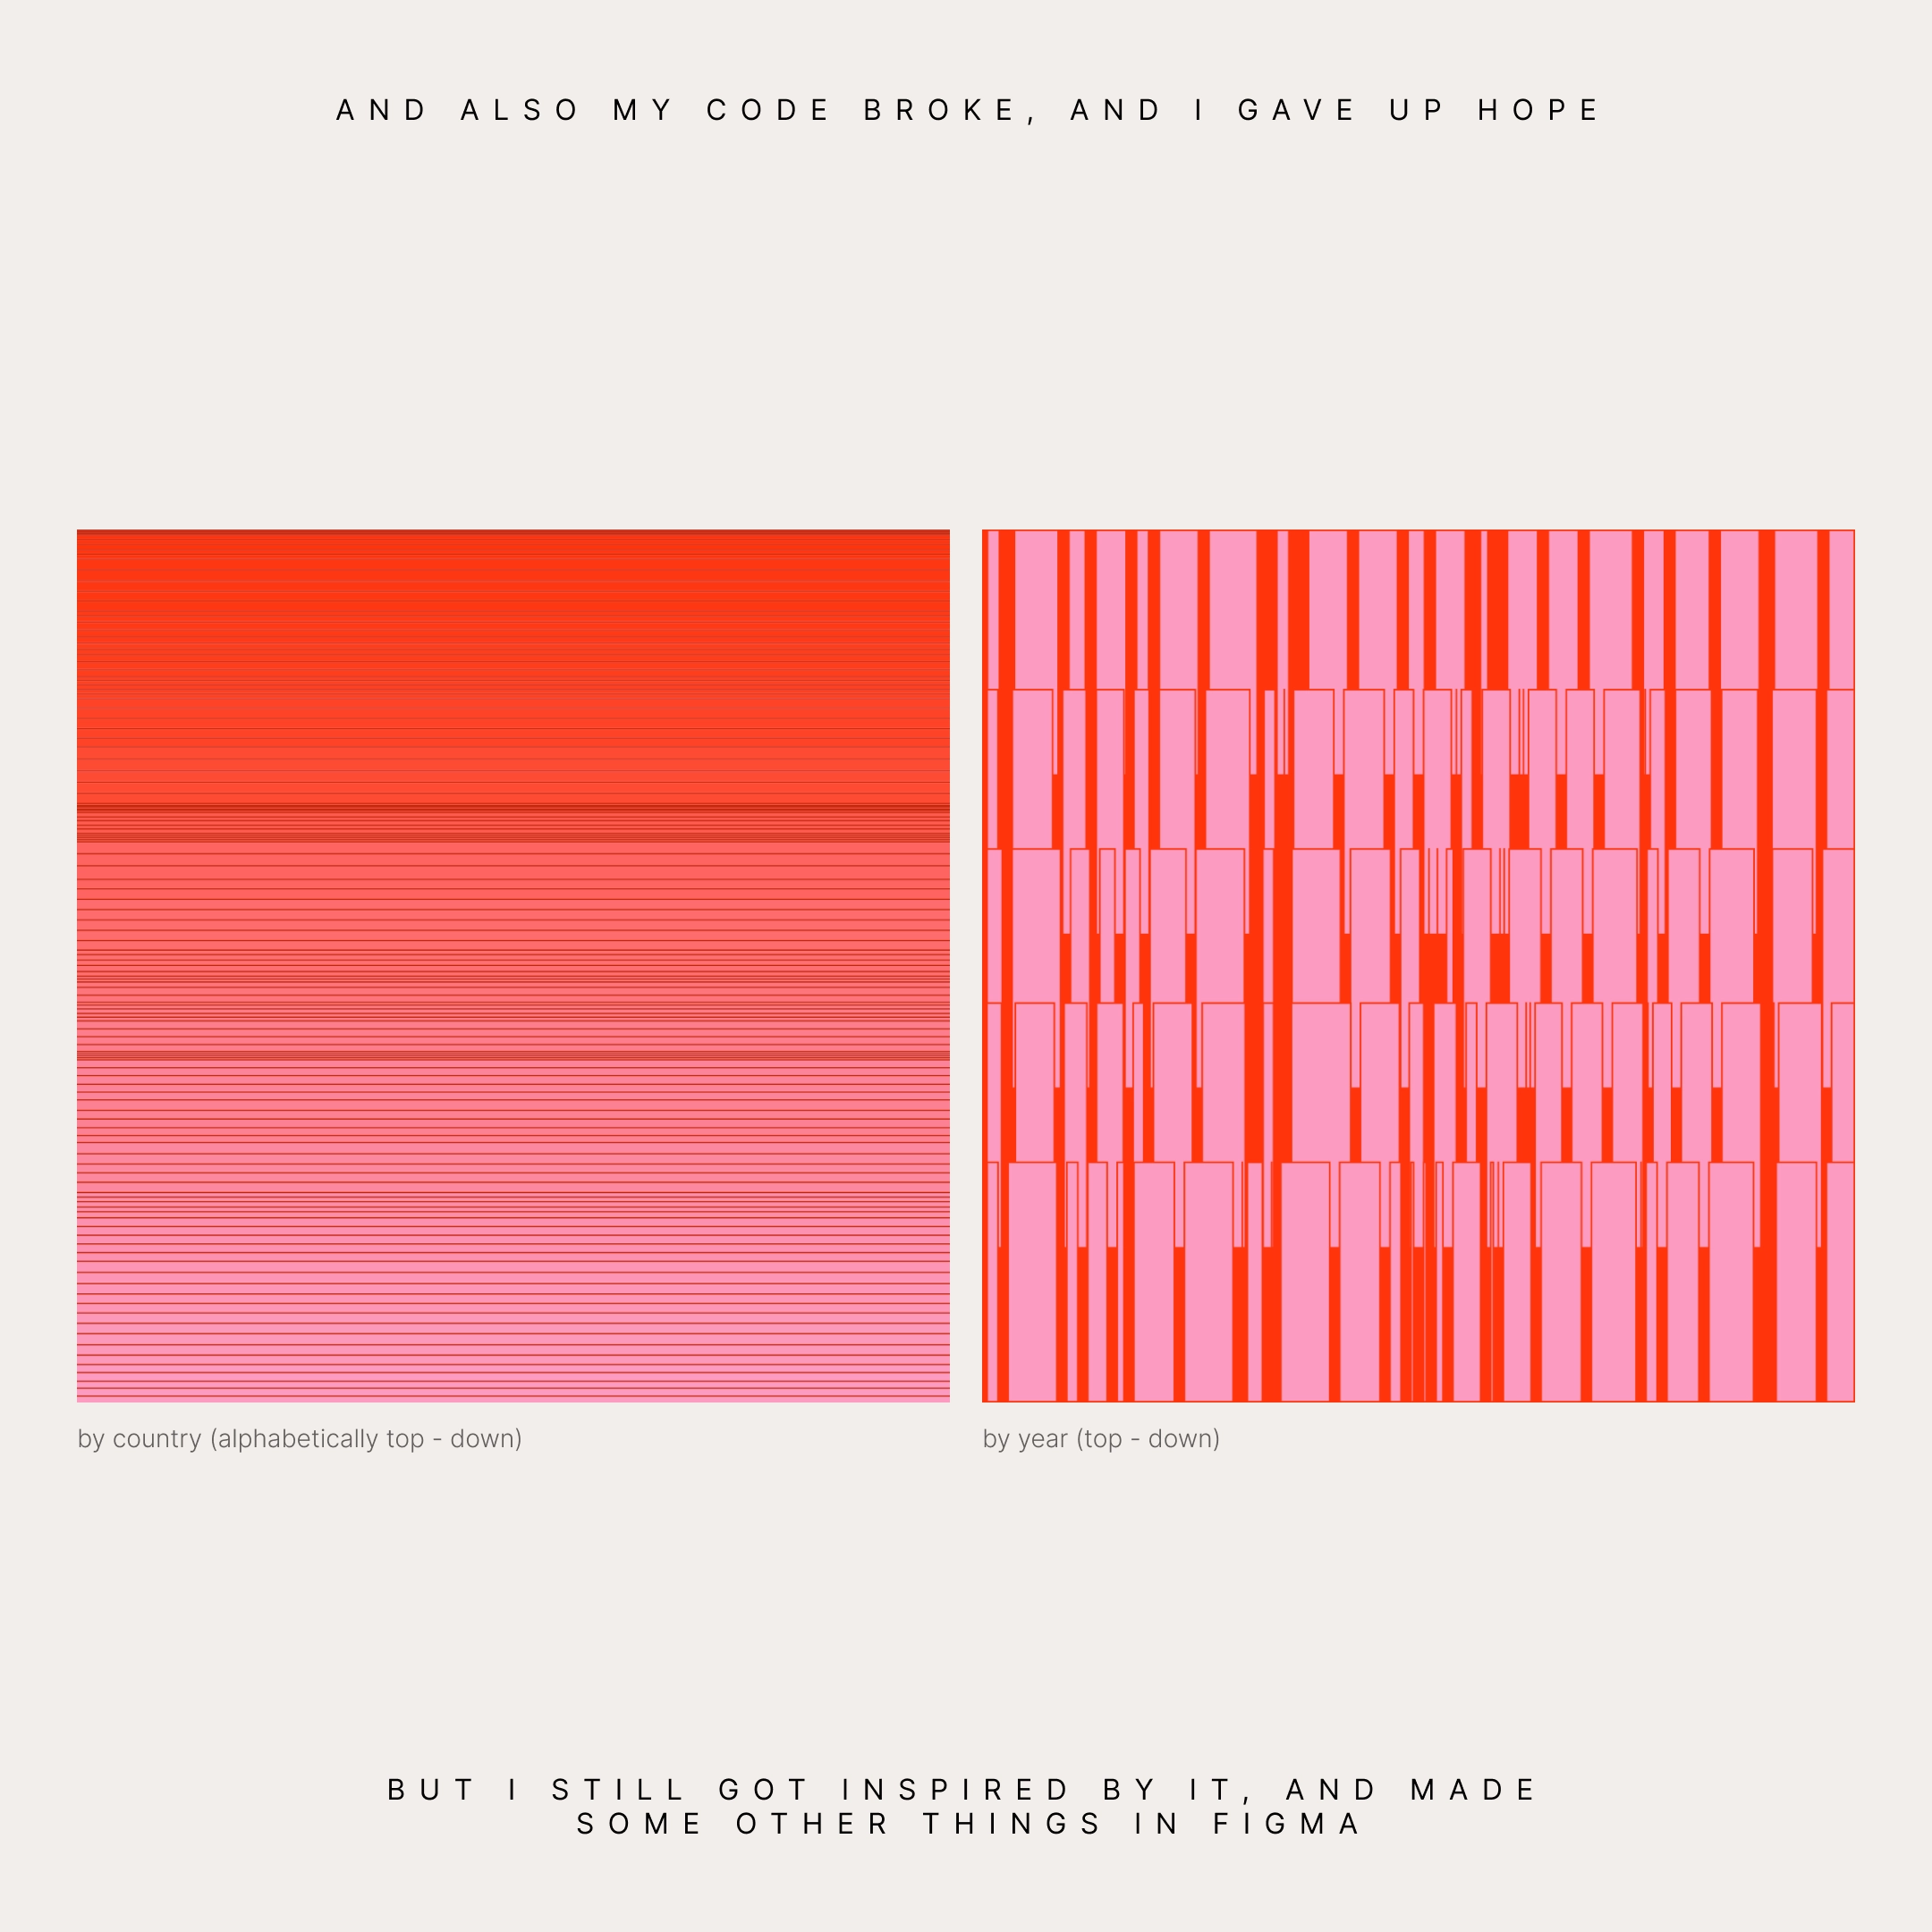
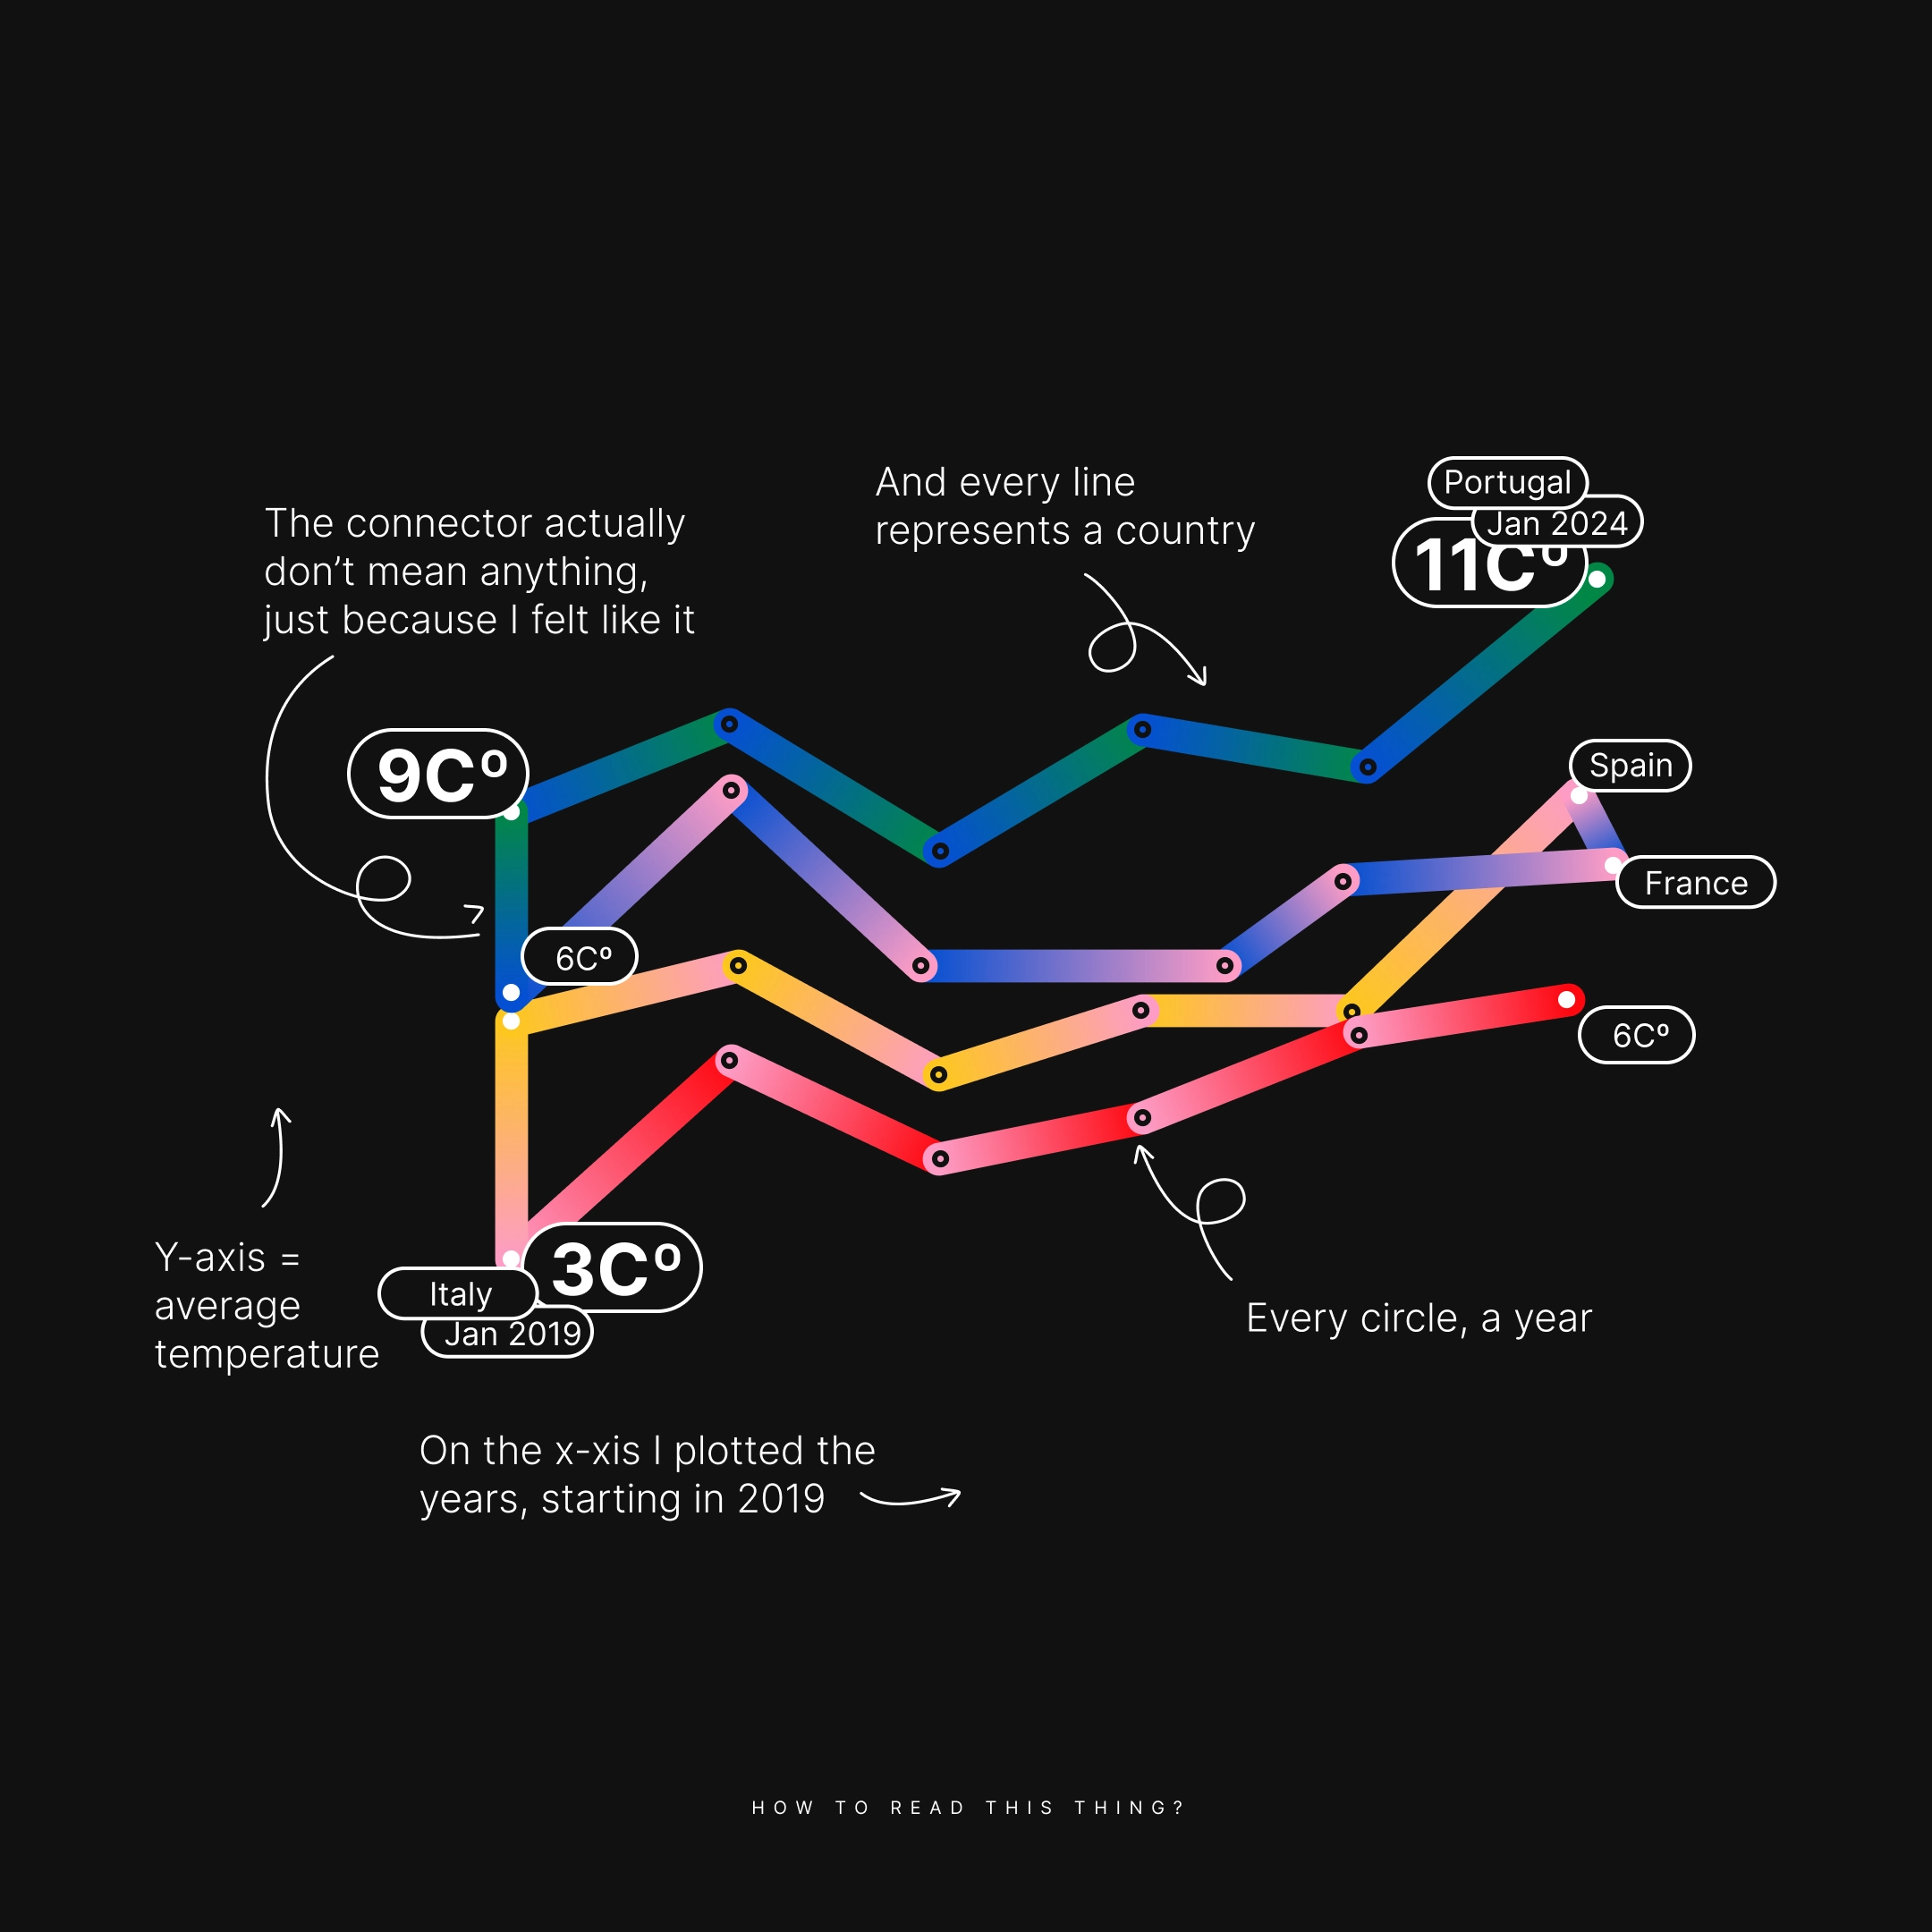
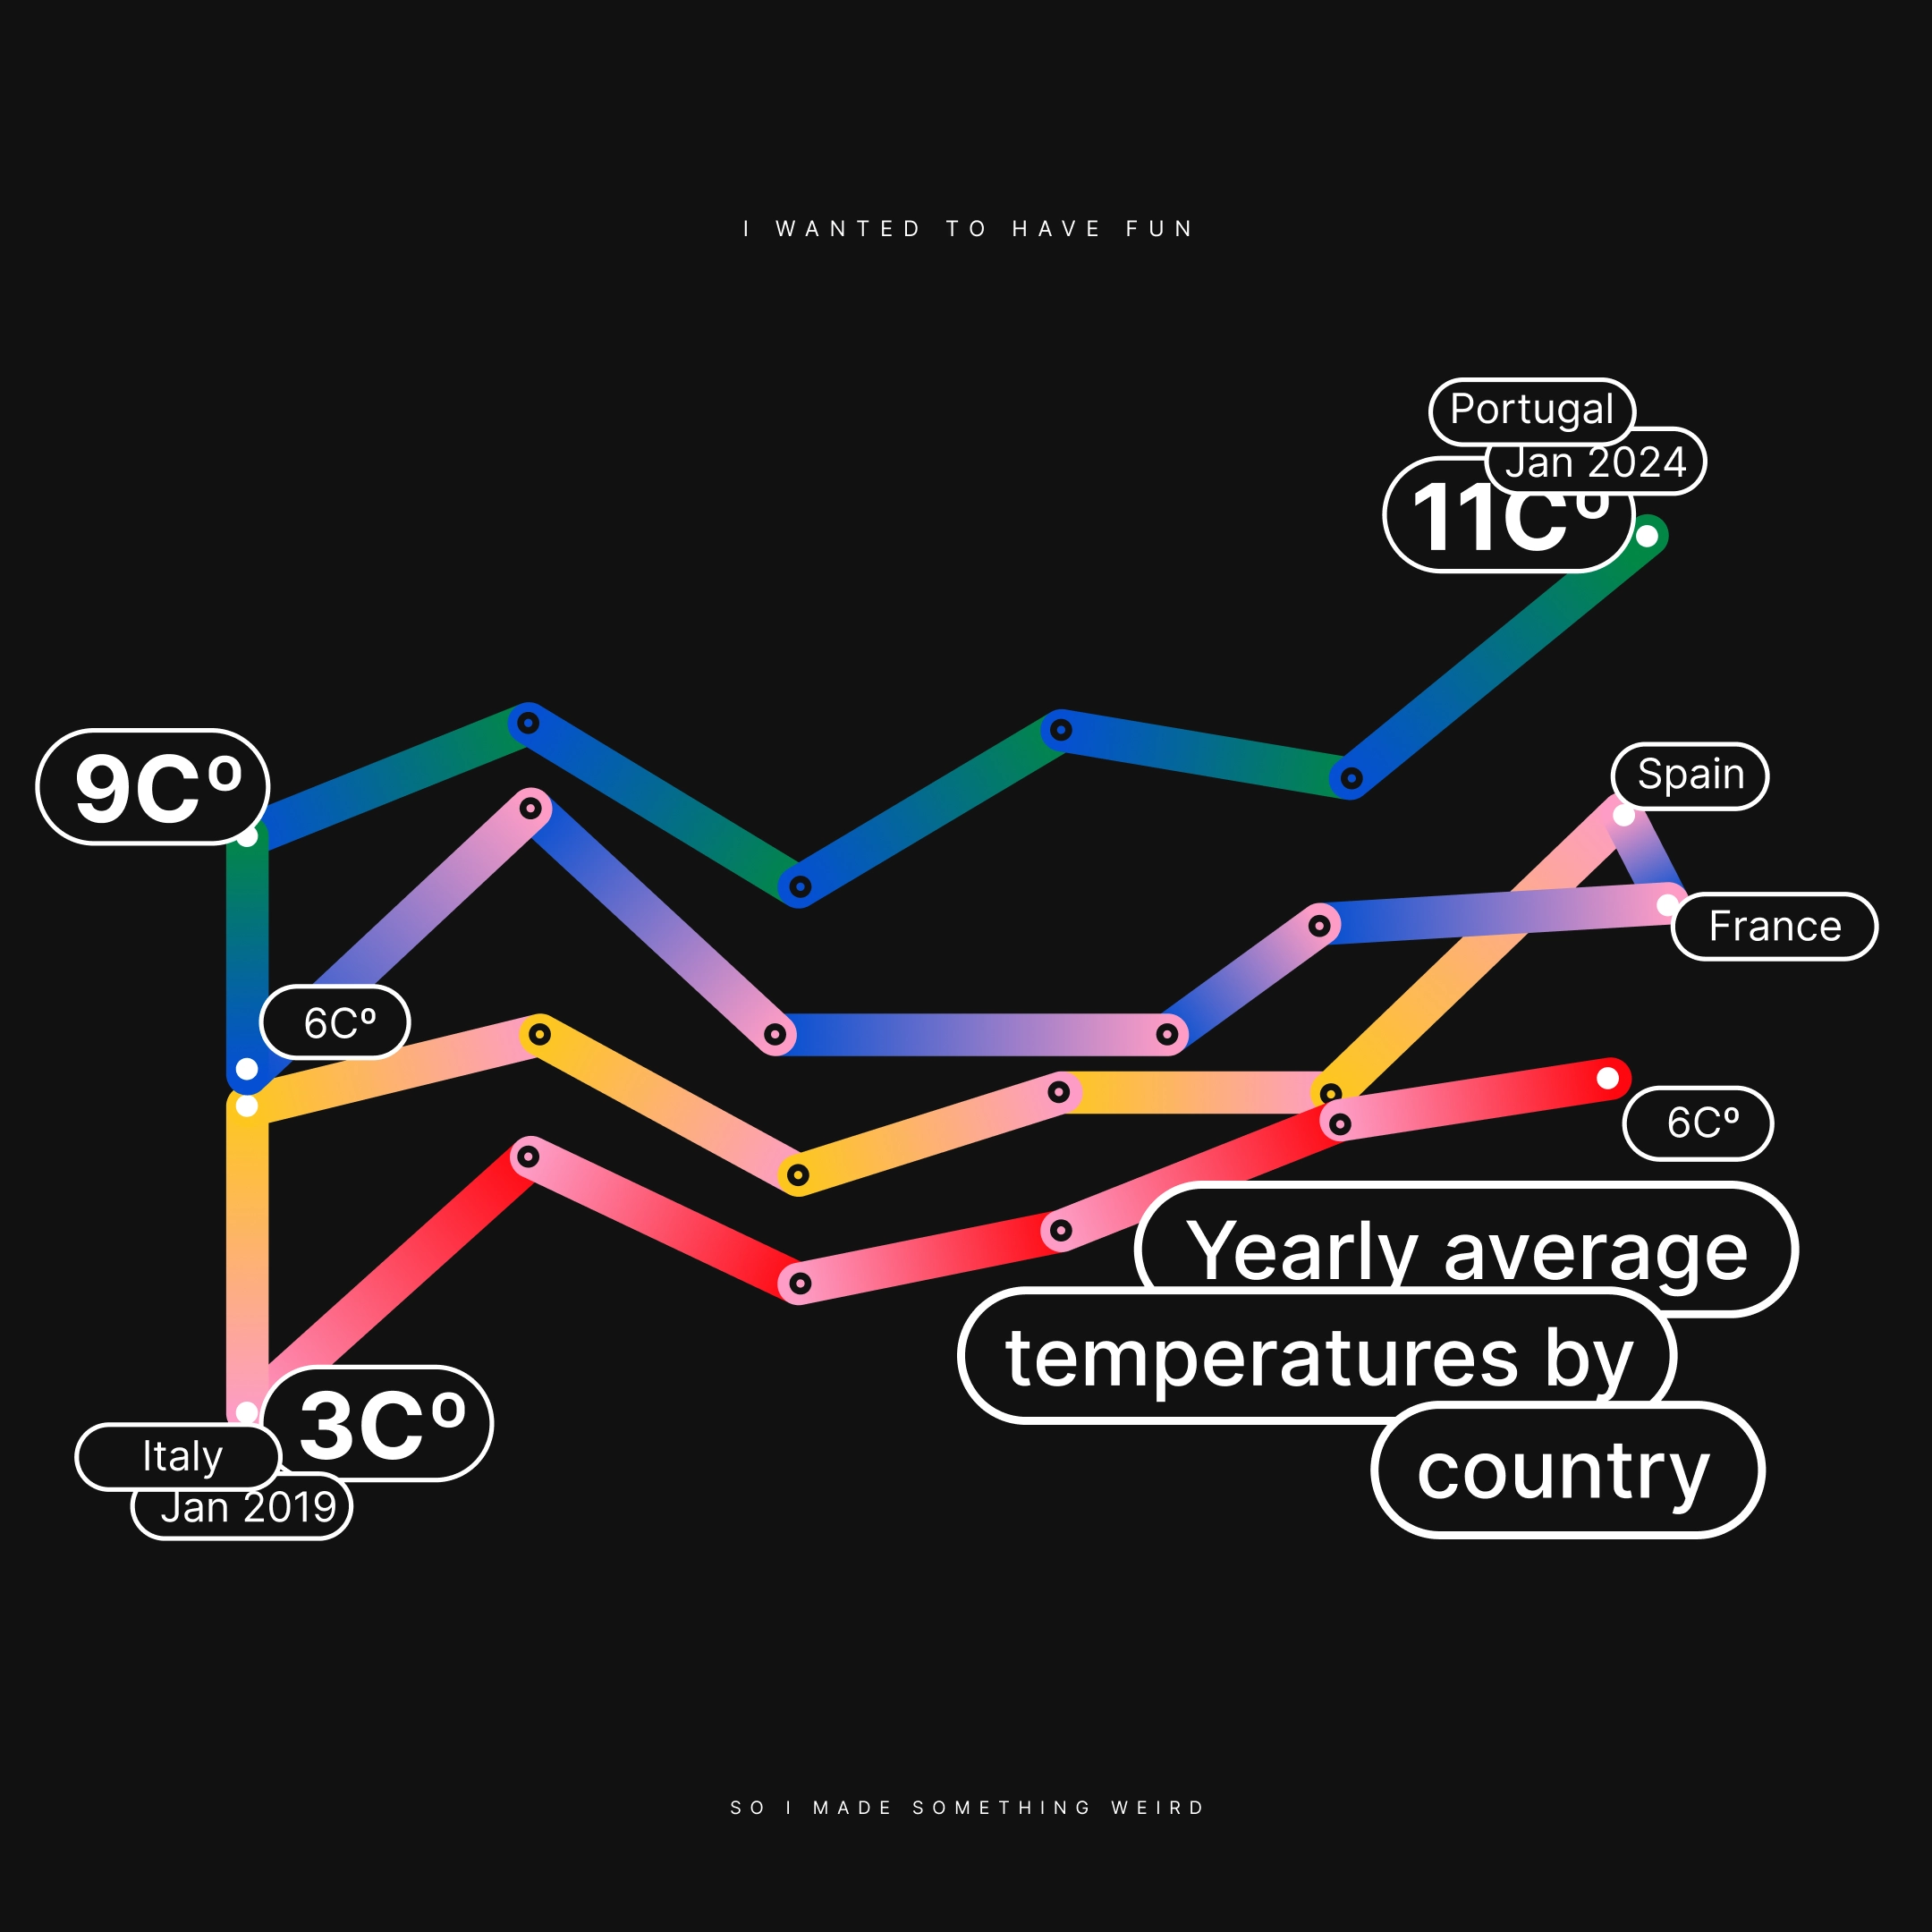
I saw some data on people using internet across the world, plus a reference of a gradient visual (I don't know who made it :( ) on pinterest and I wanted to make something with it.
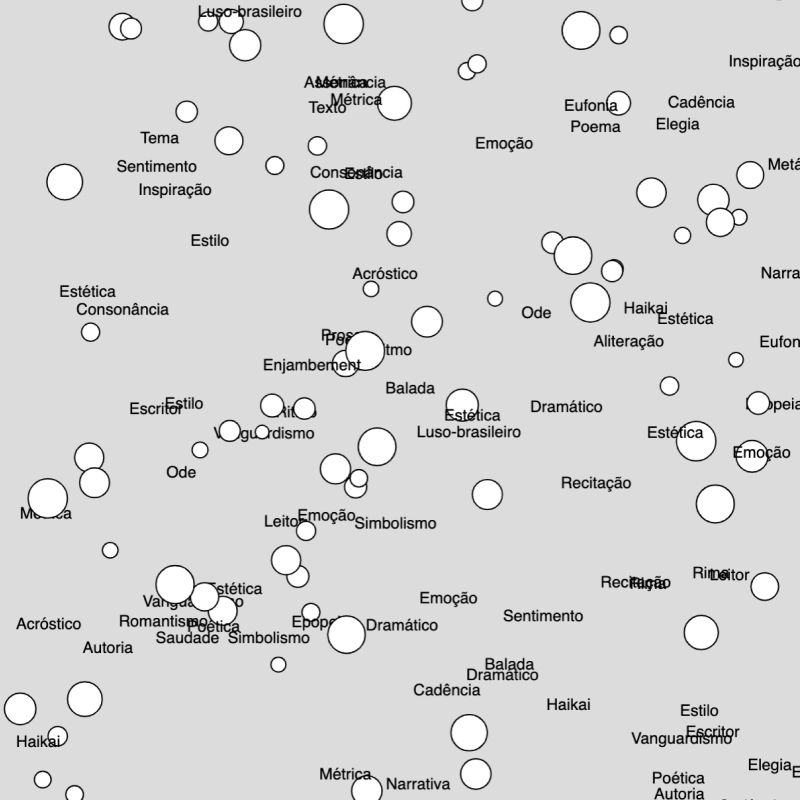
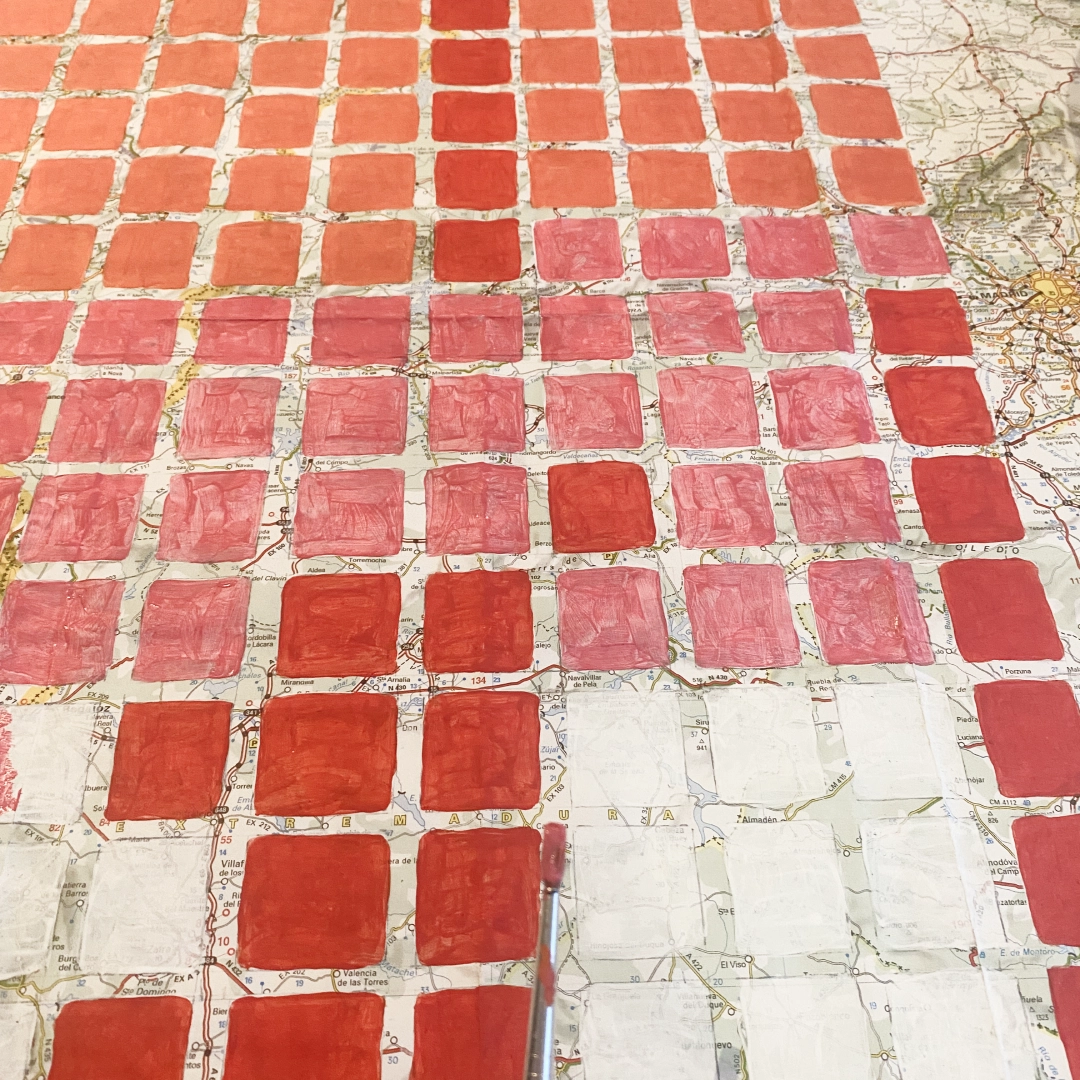
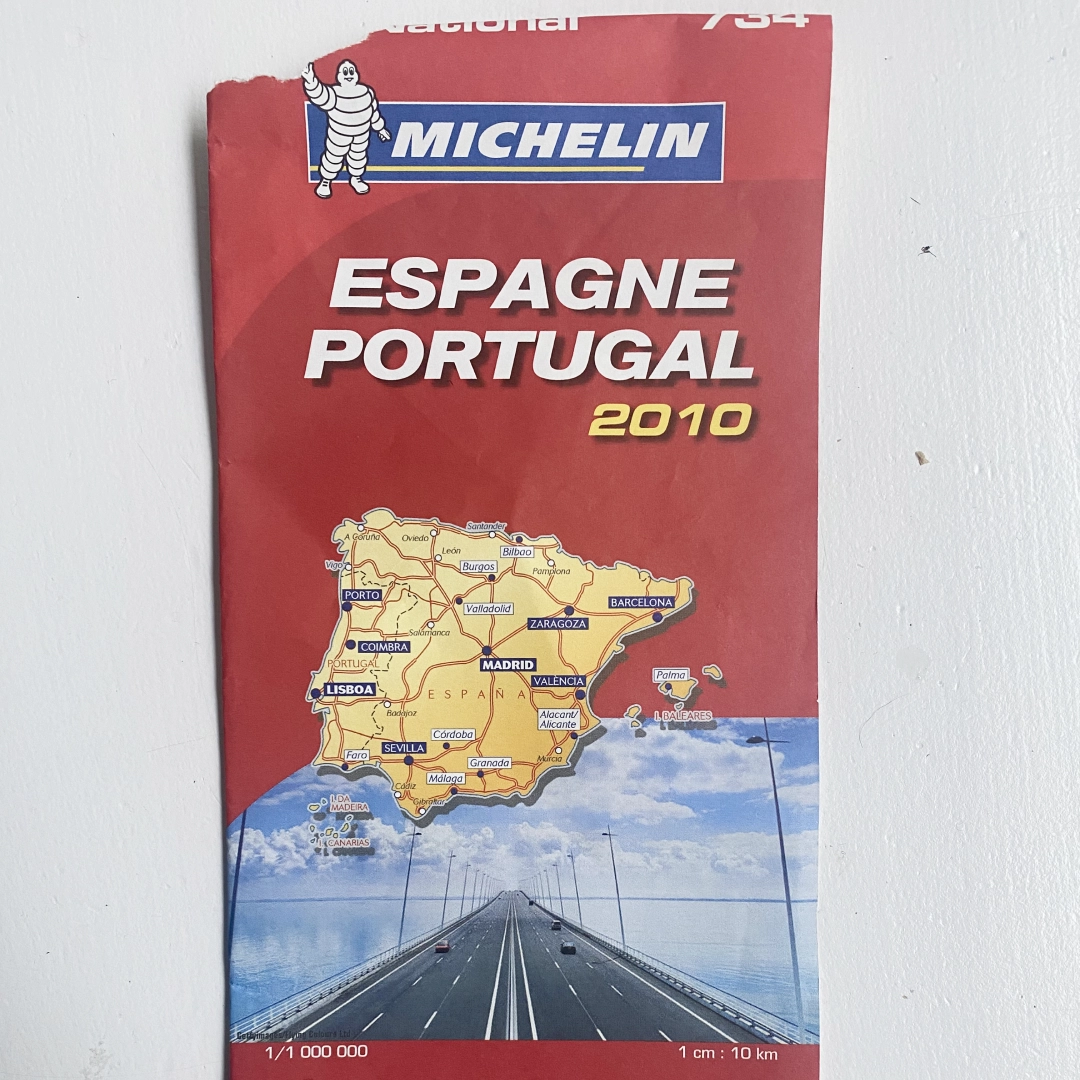
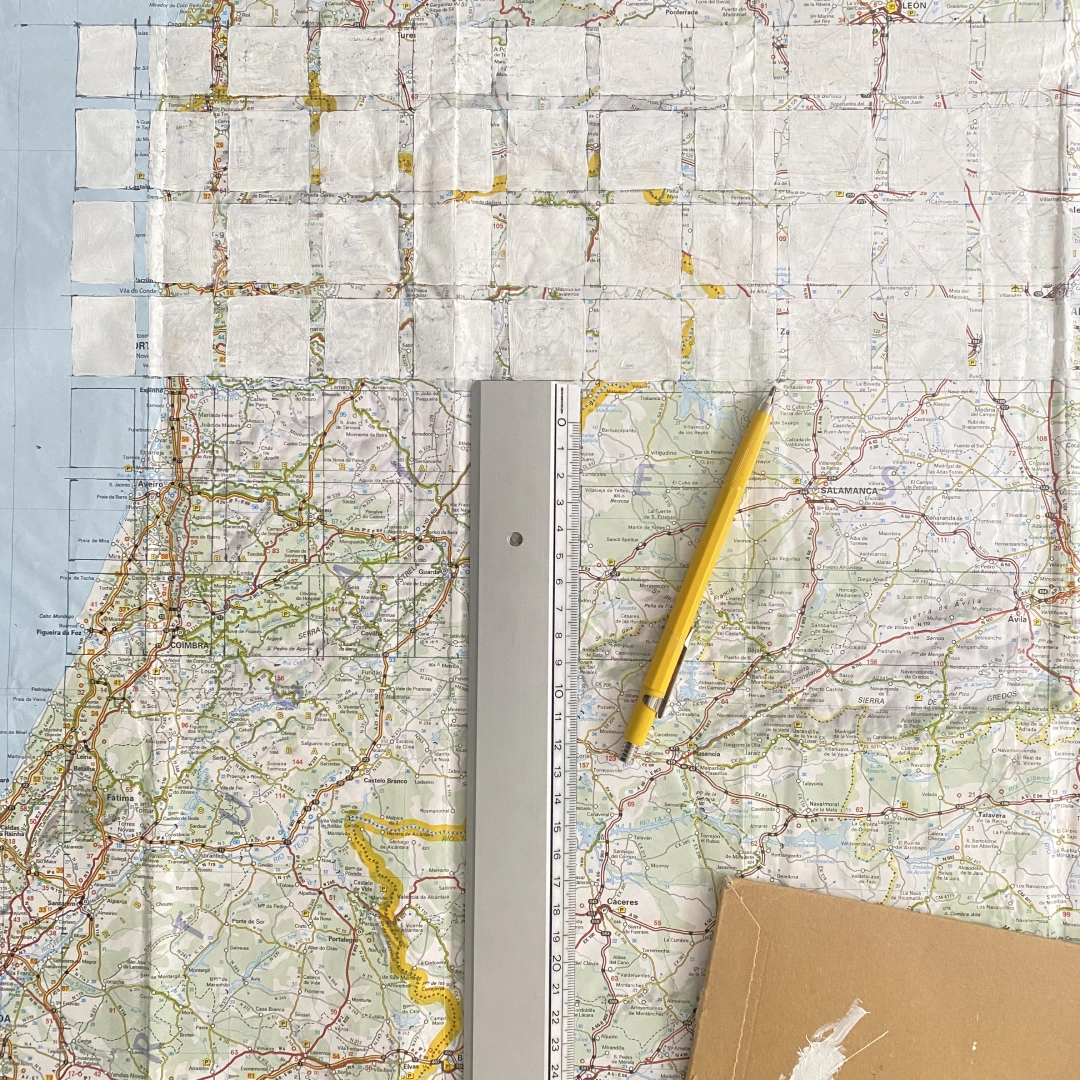
I wanted to plot portuguese literature with code. Gave up right in the start, but still like how random it looks.
Using p5 to plot data again, not 100% correct but sitll like how it looks.
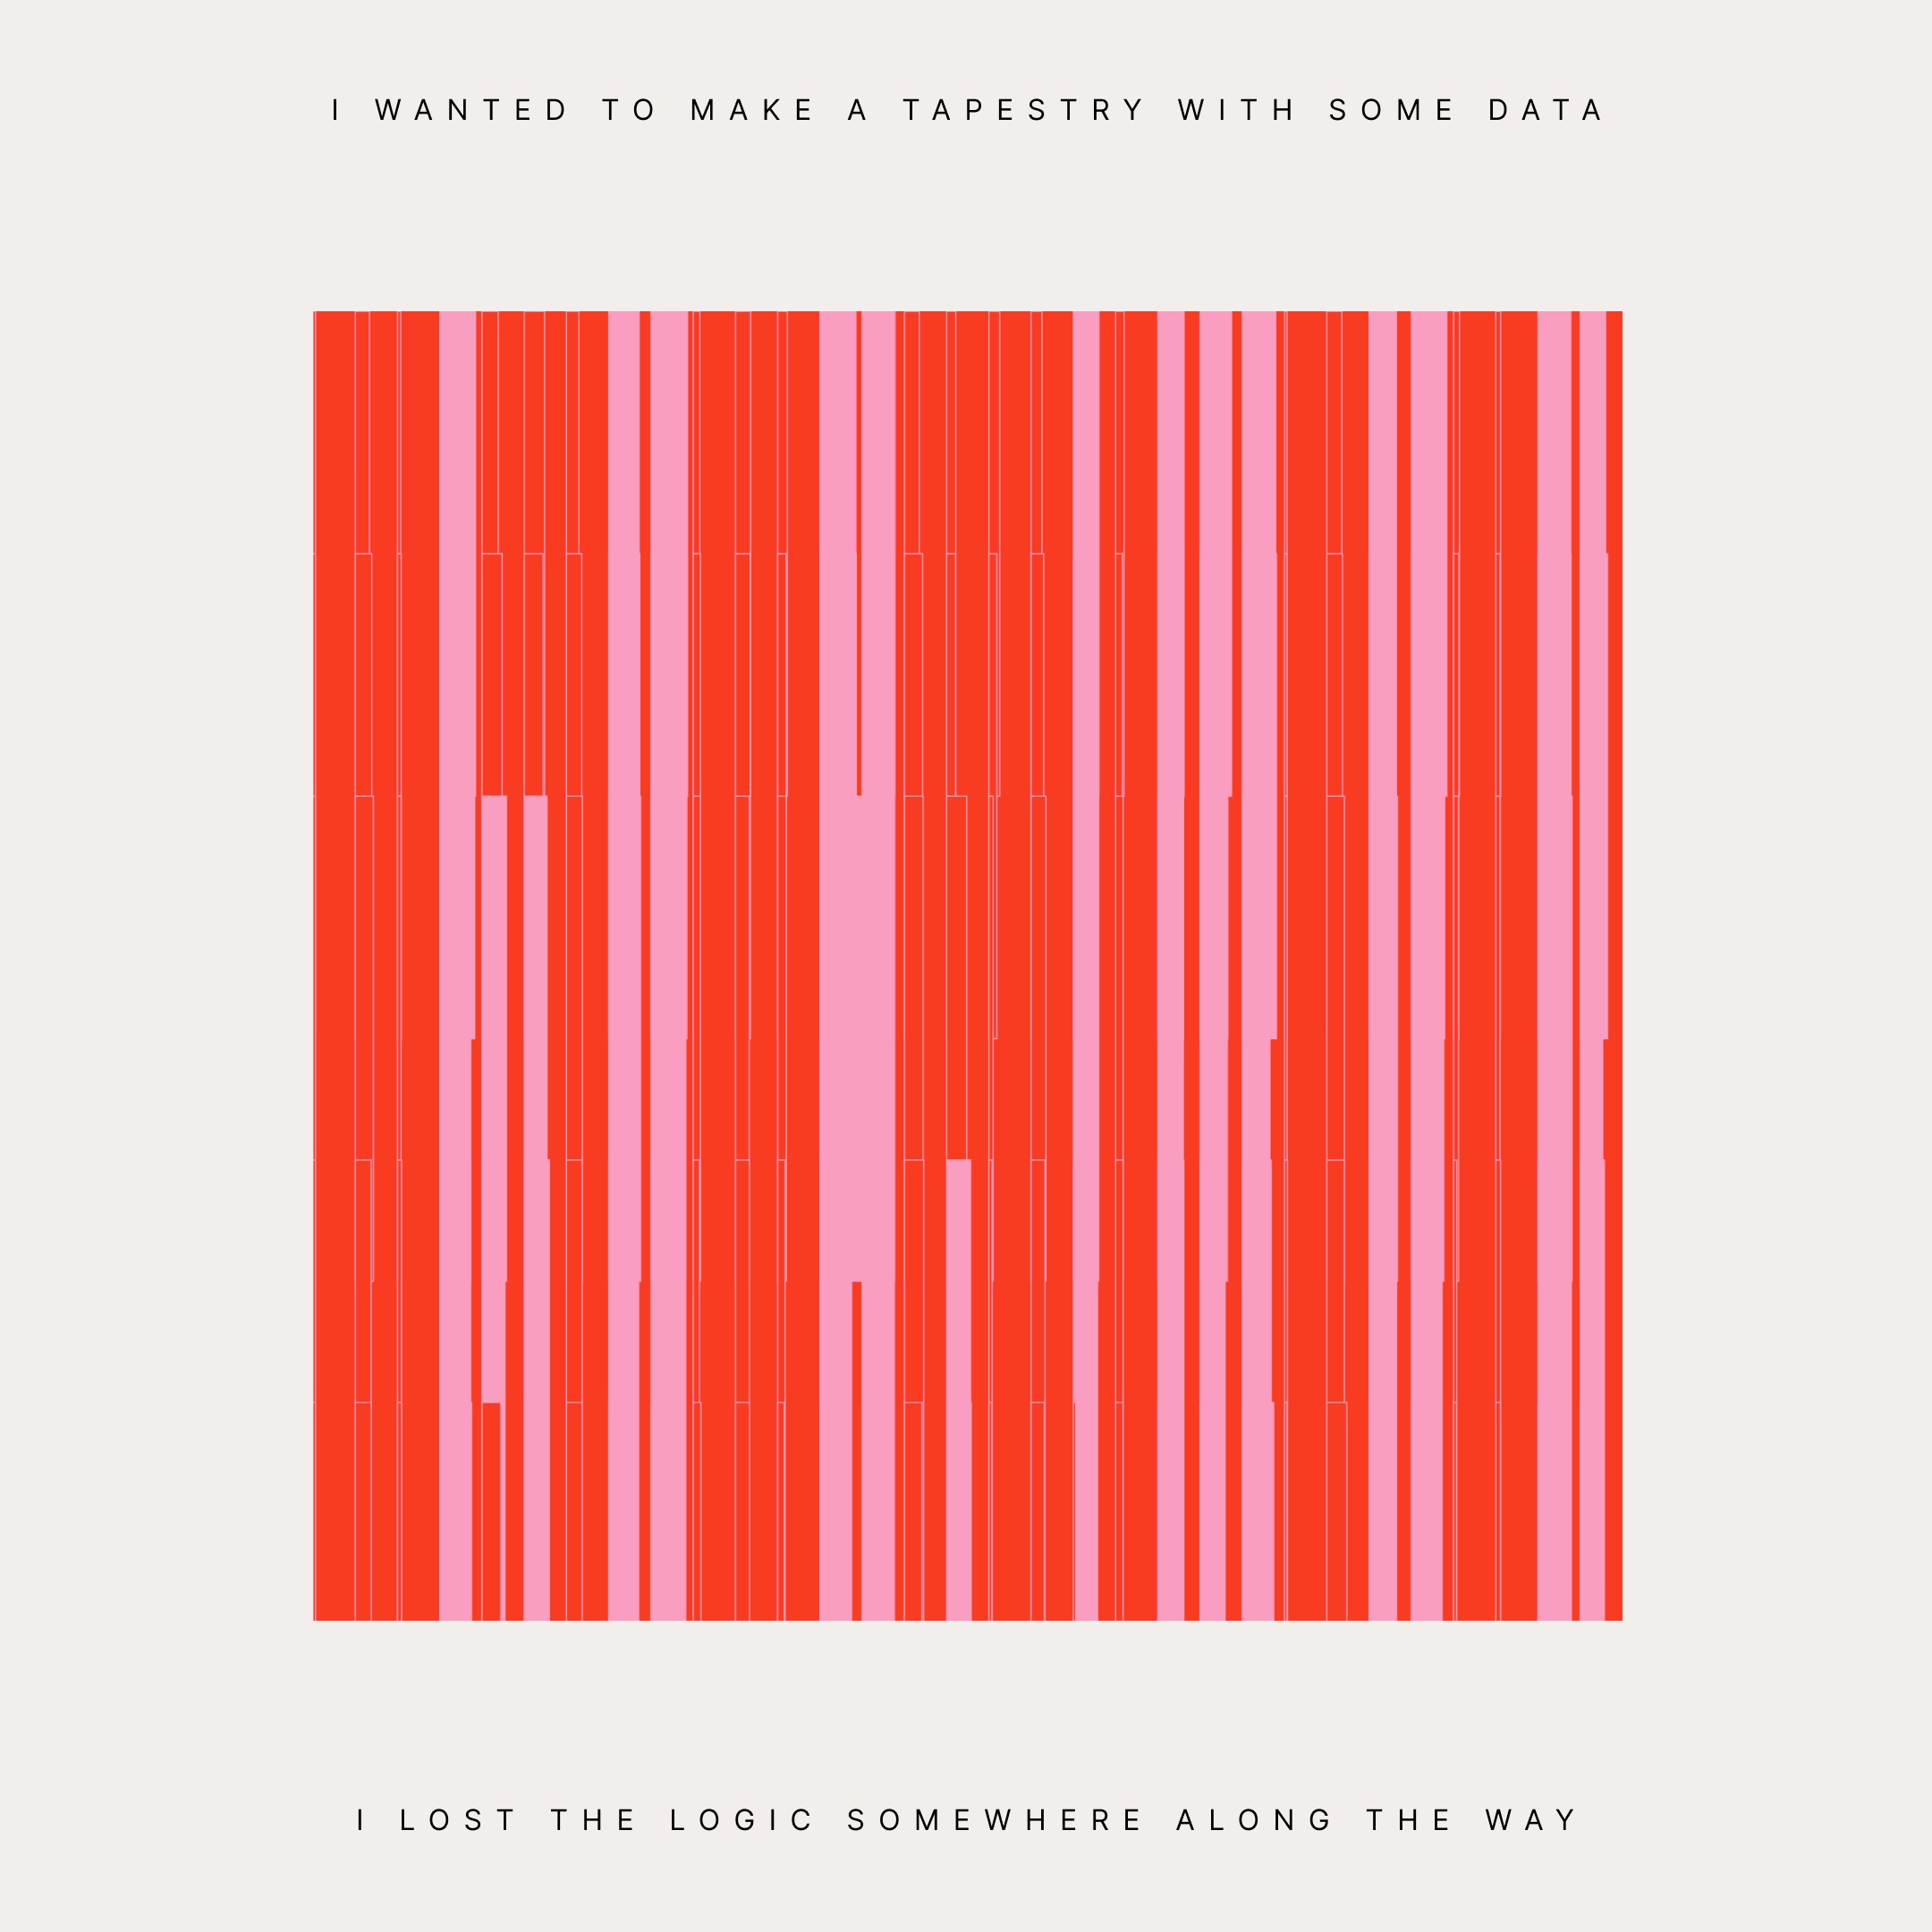
I wanted to make a tapestry with some data, but I lost track at some point. Still looked nice though.
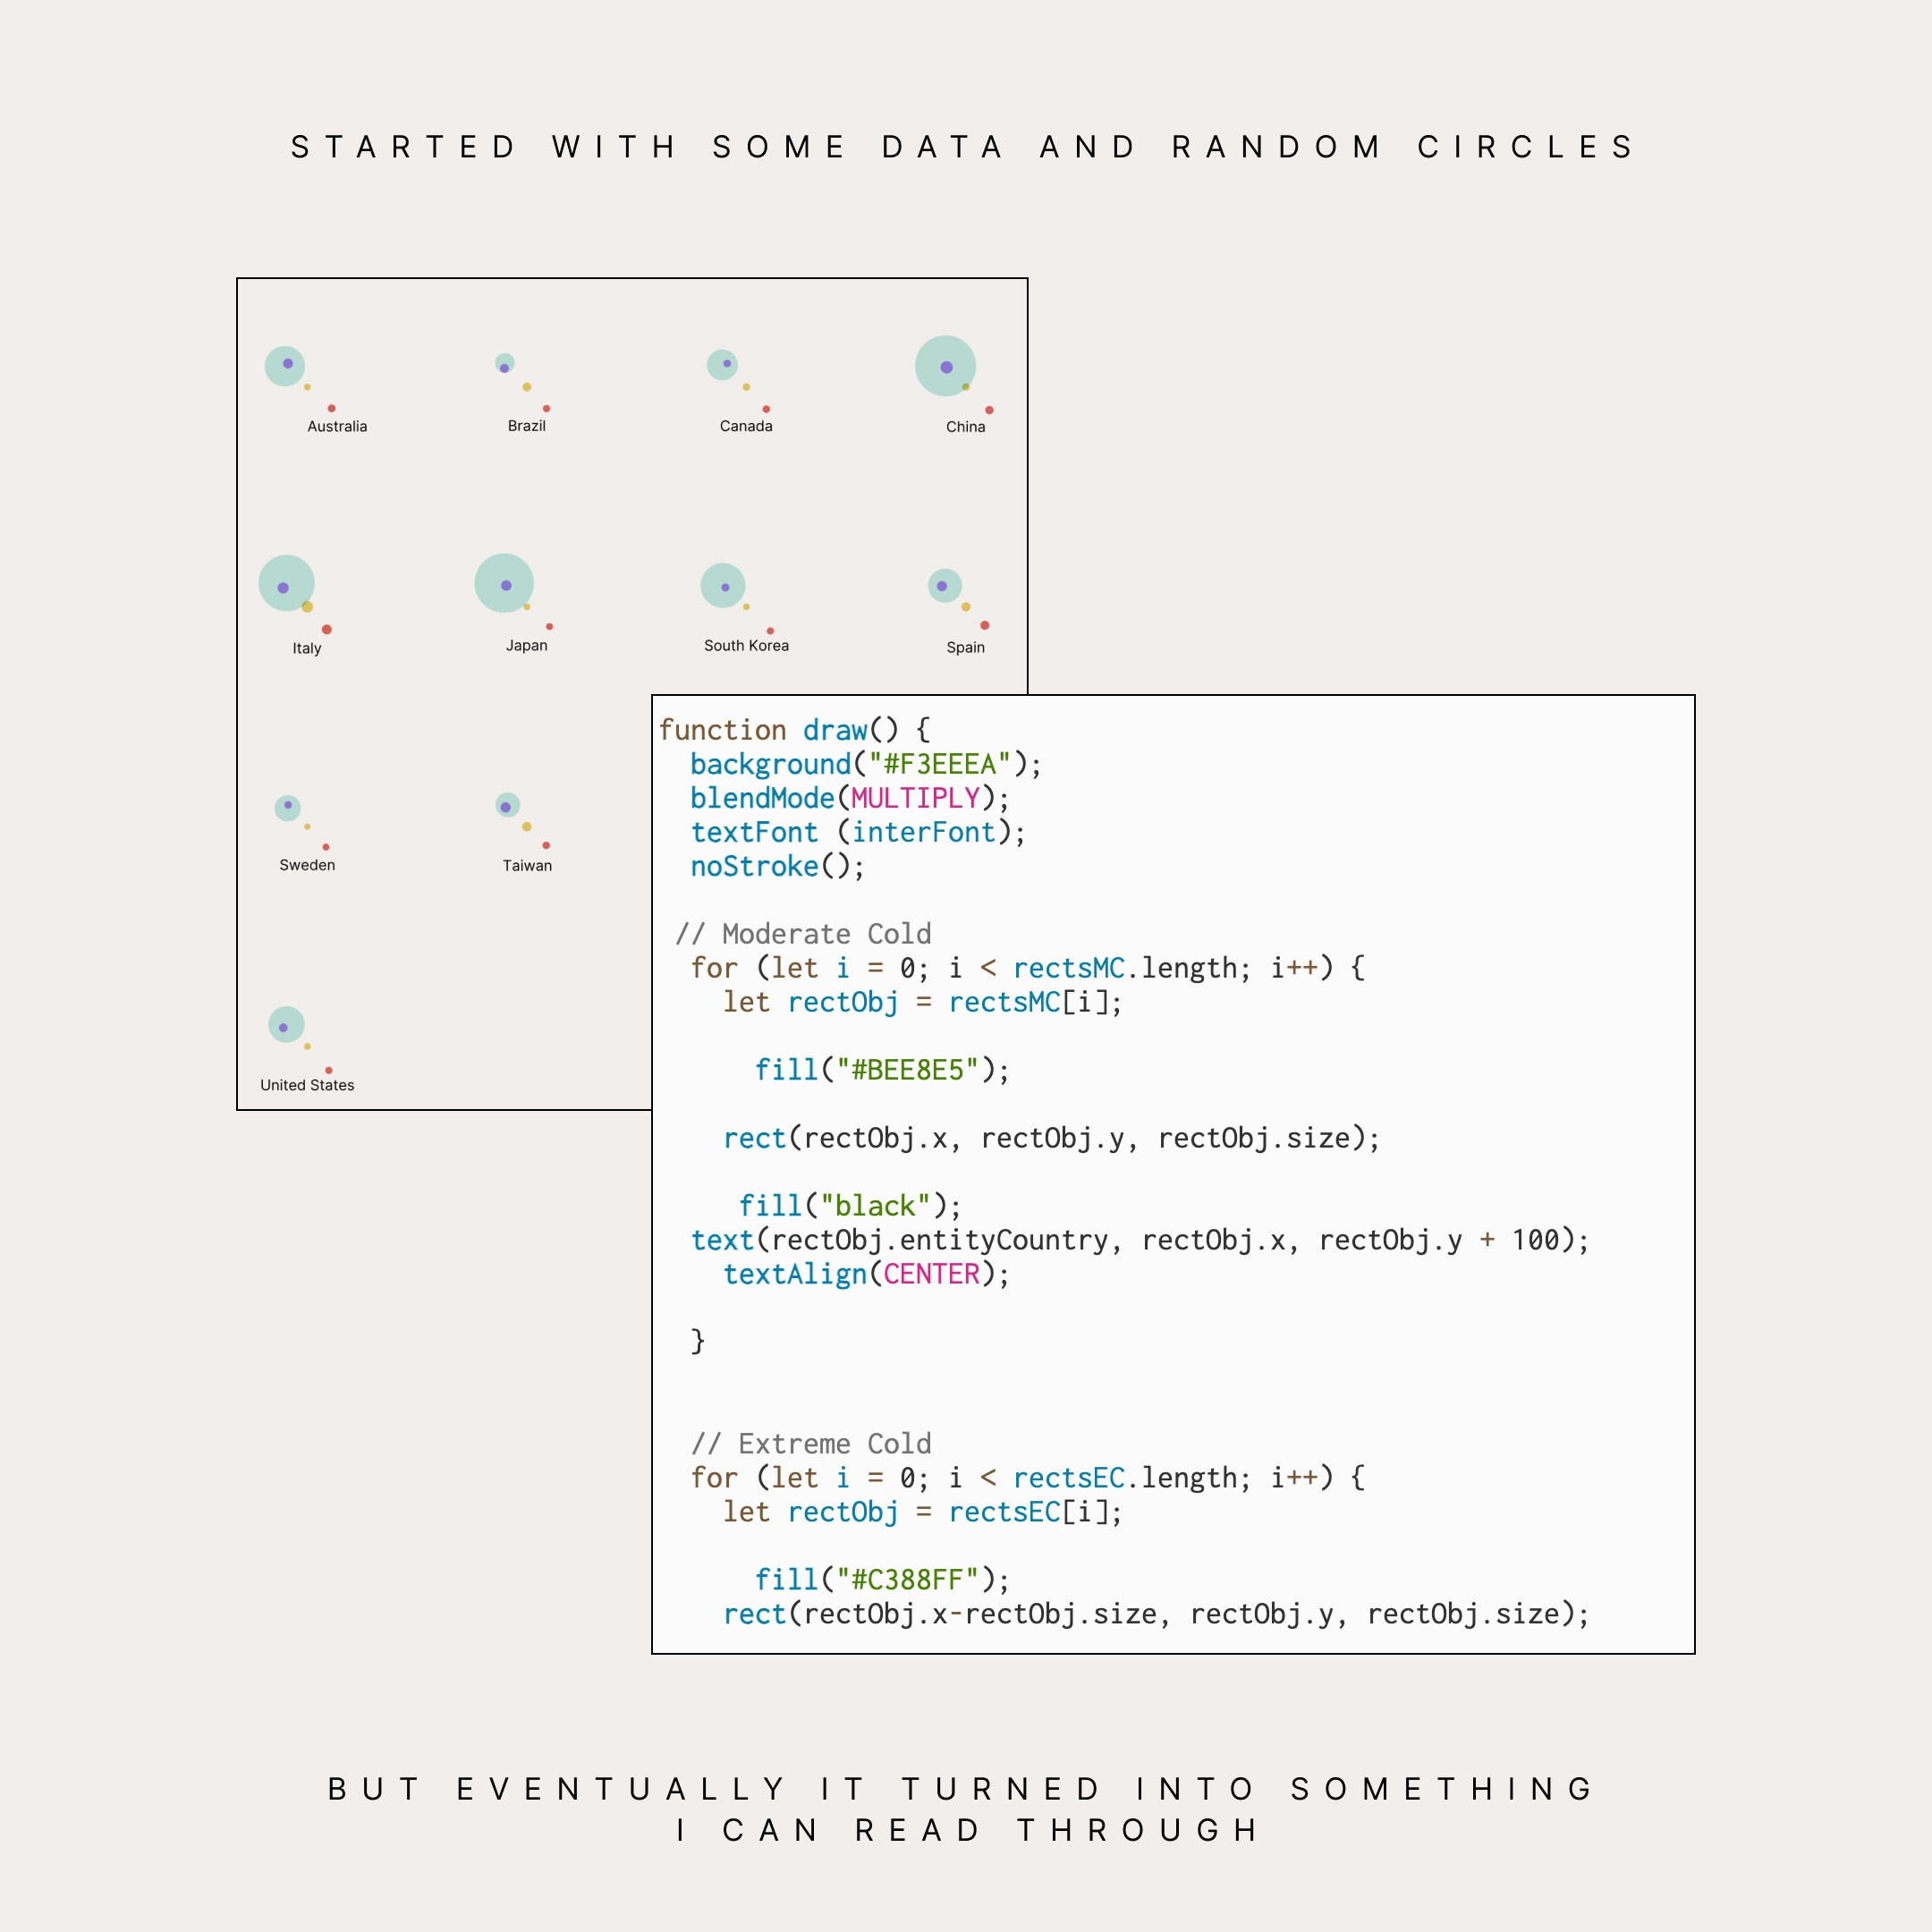
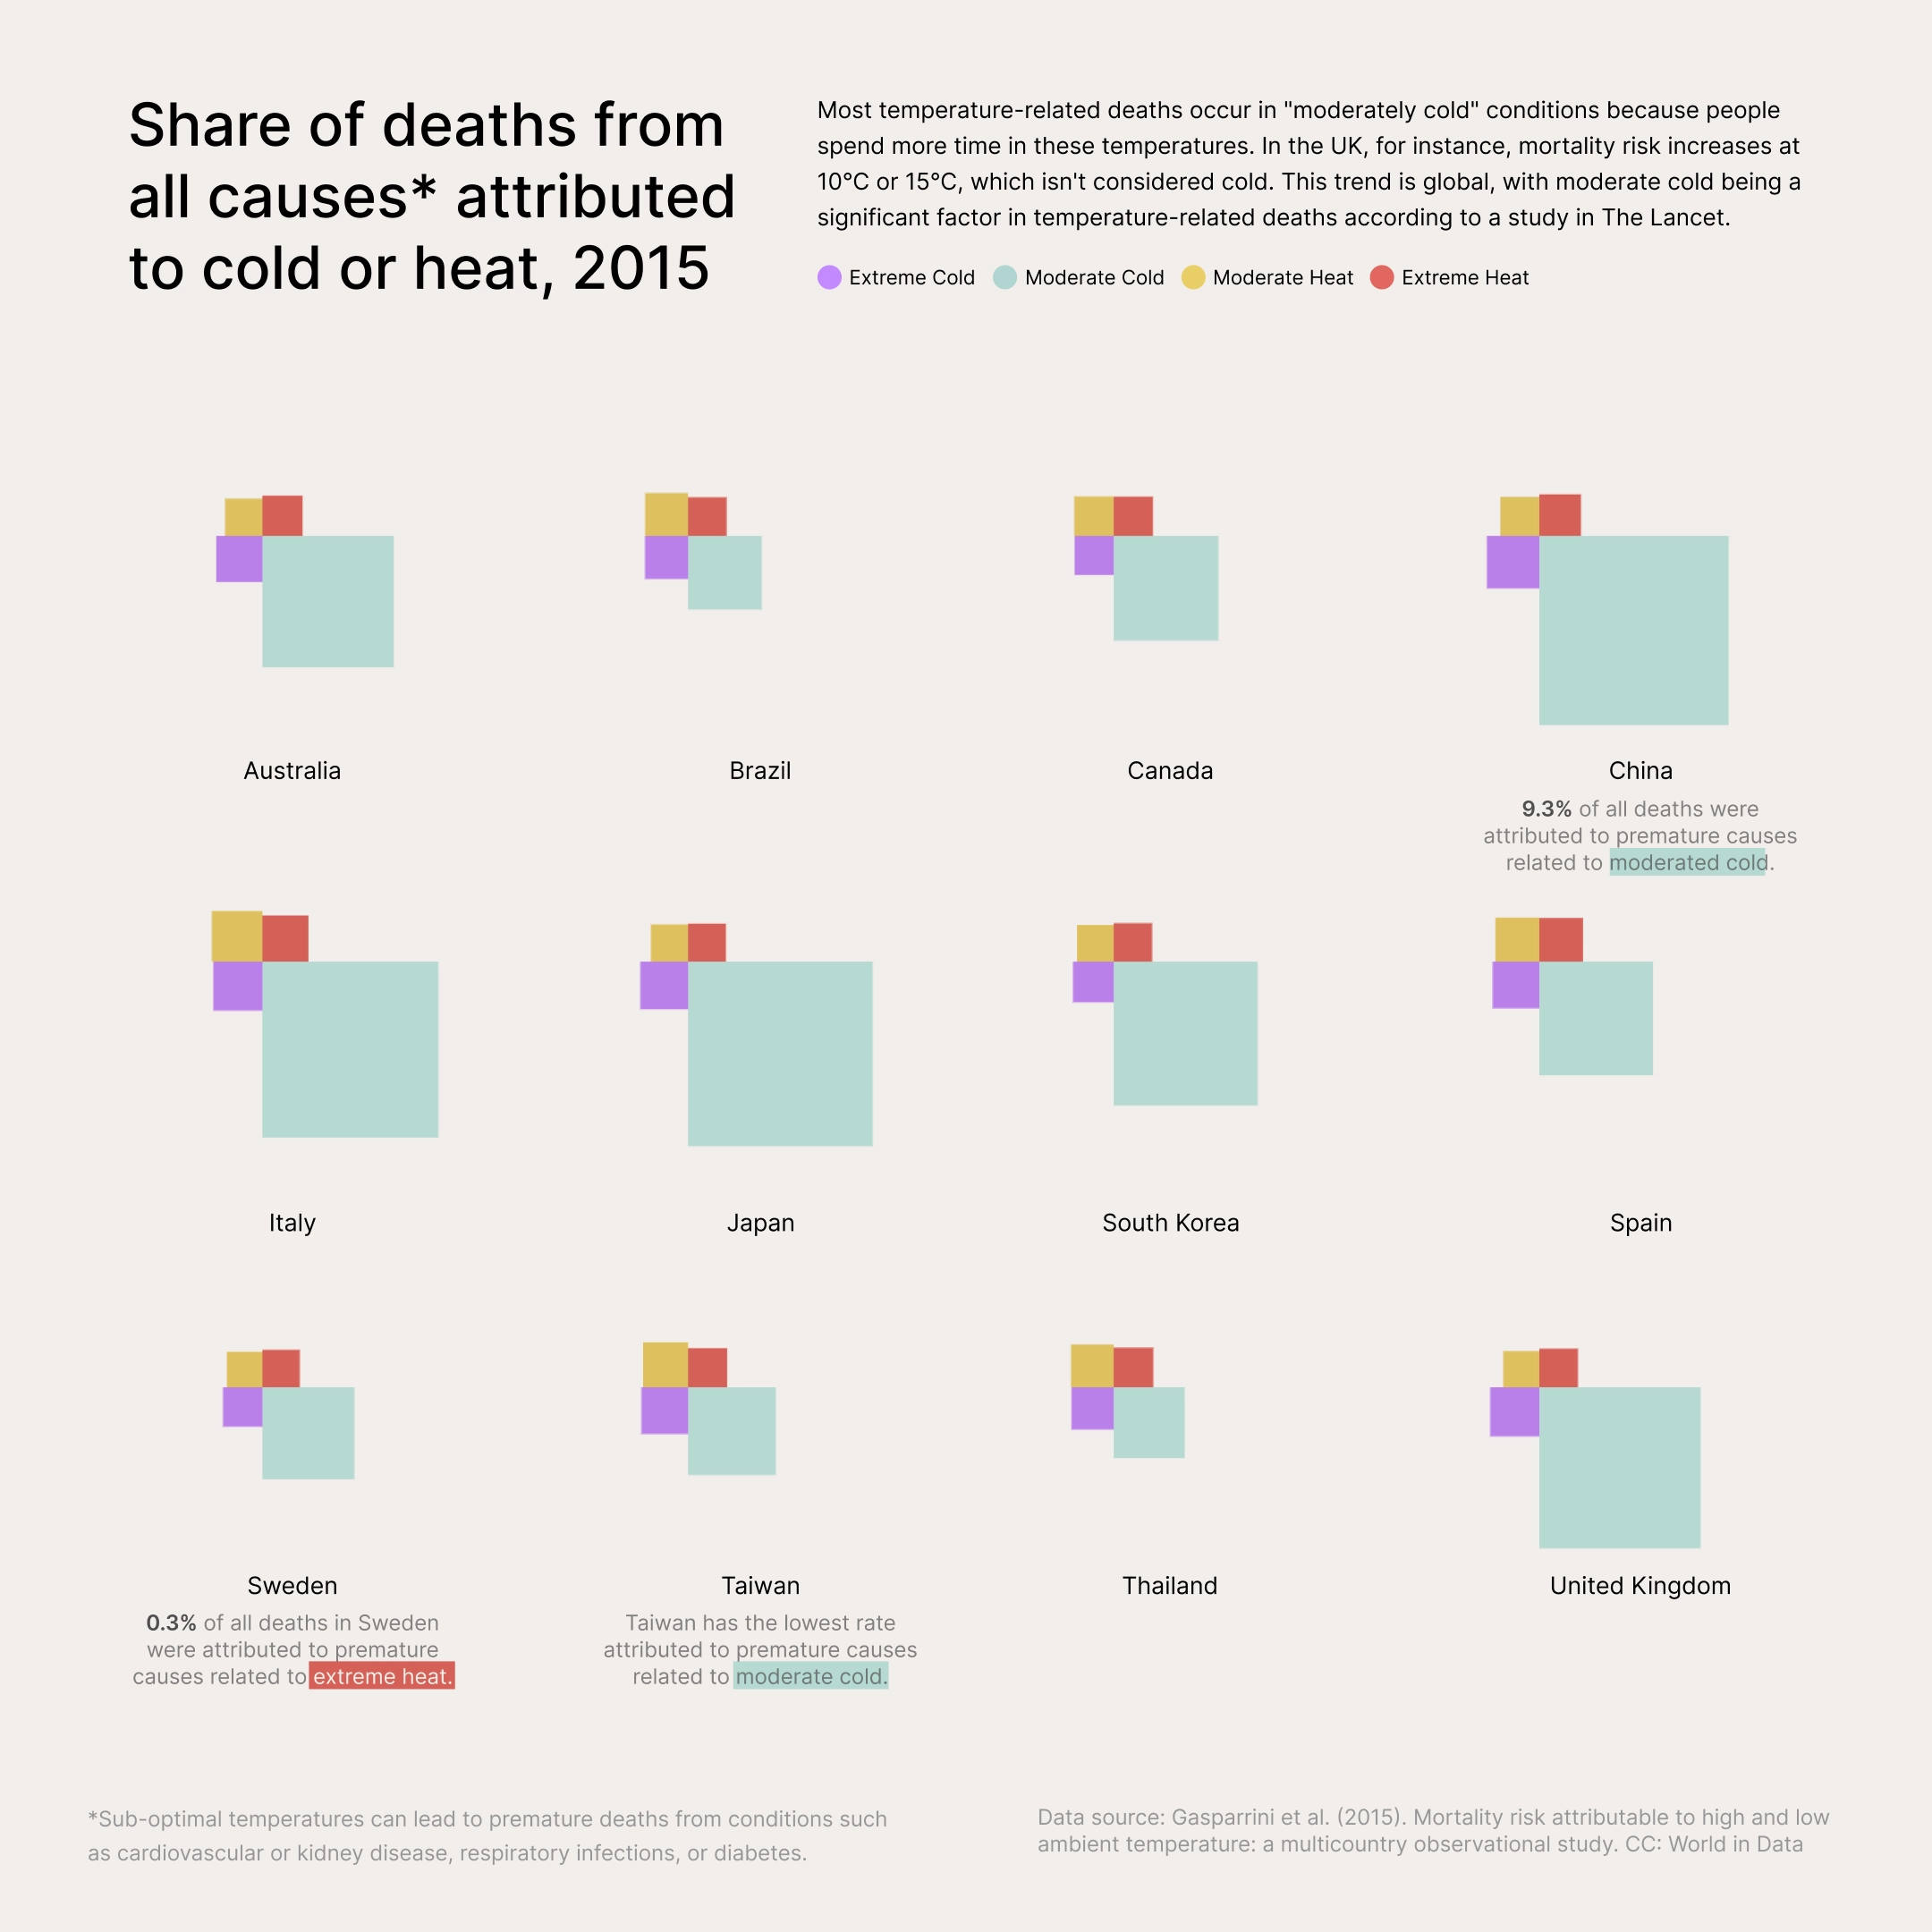
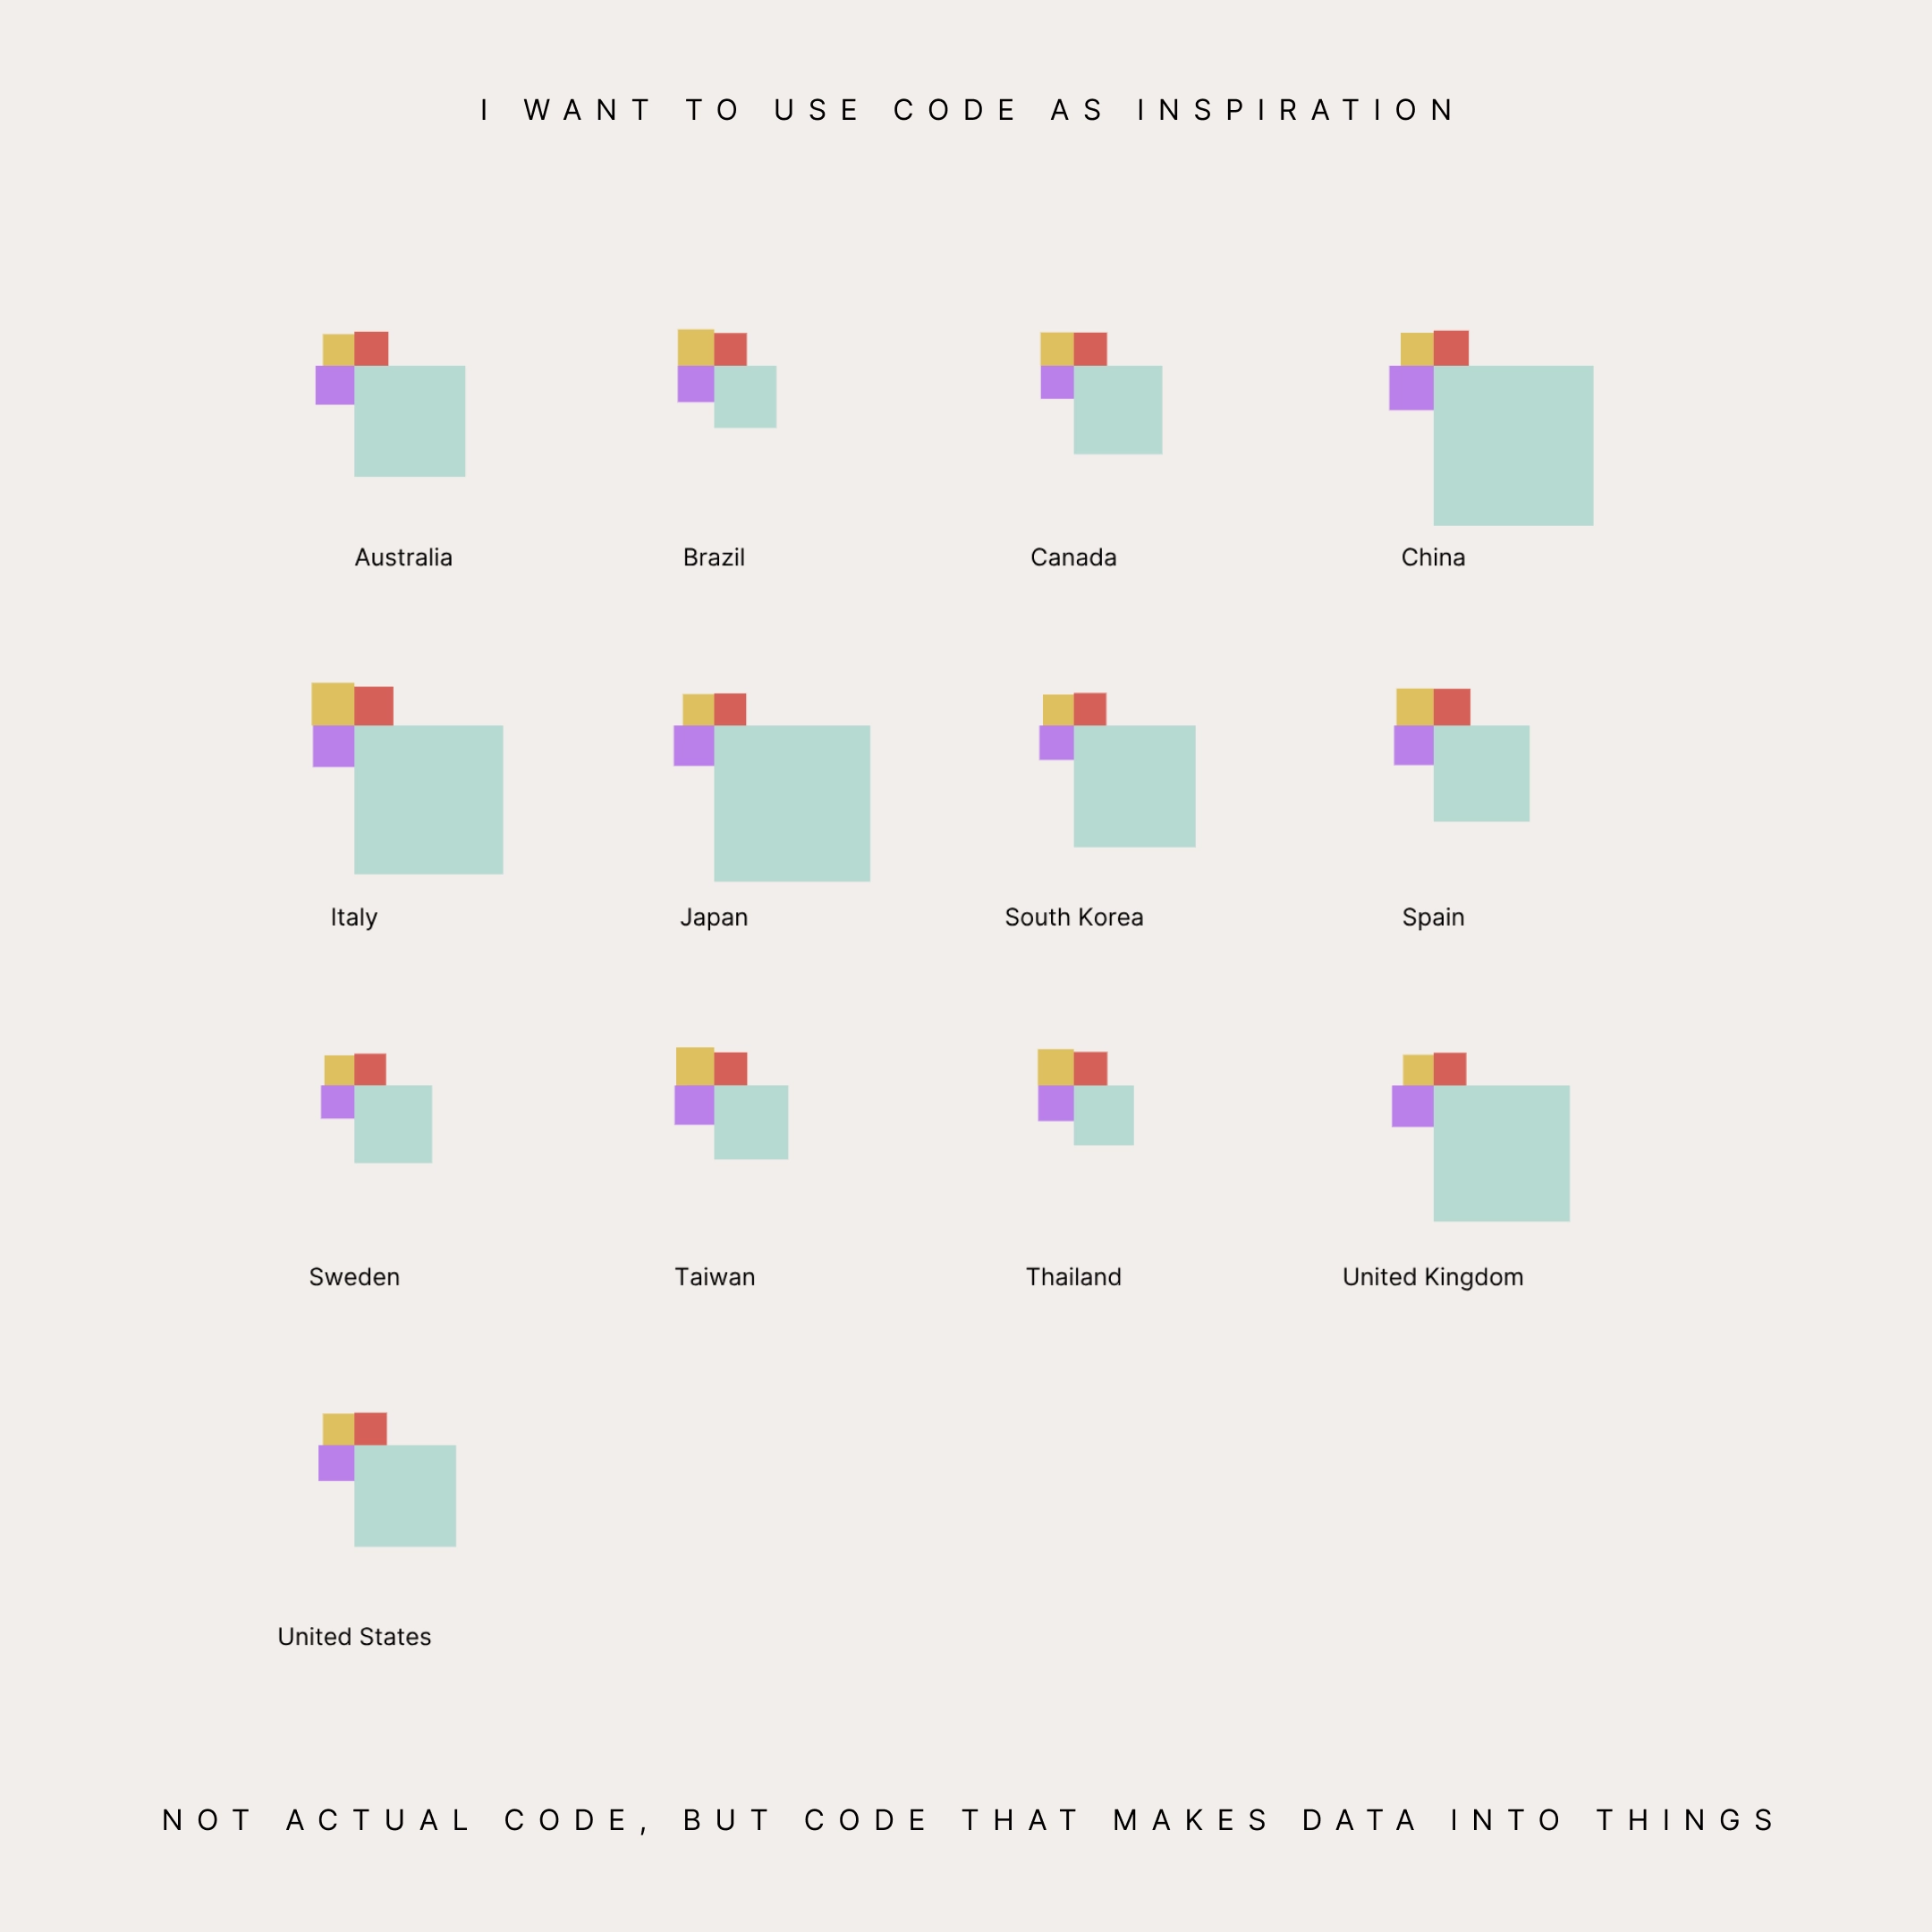
I want to use code as inspiration, not actual code, but code that makes data into things.
I said goodbye to a car, but kept all the memories. 2 license plates after and almost 20 years.
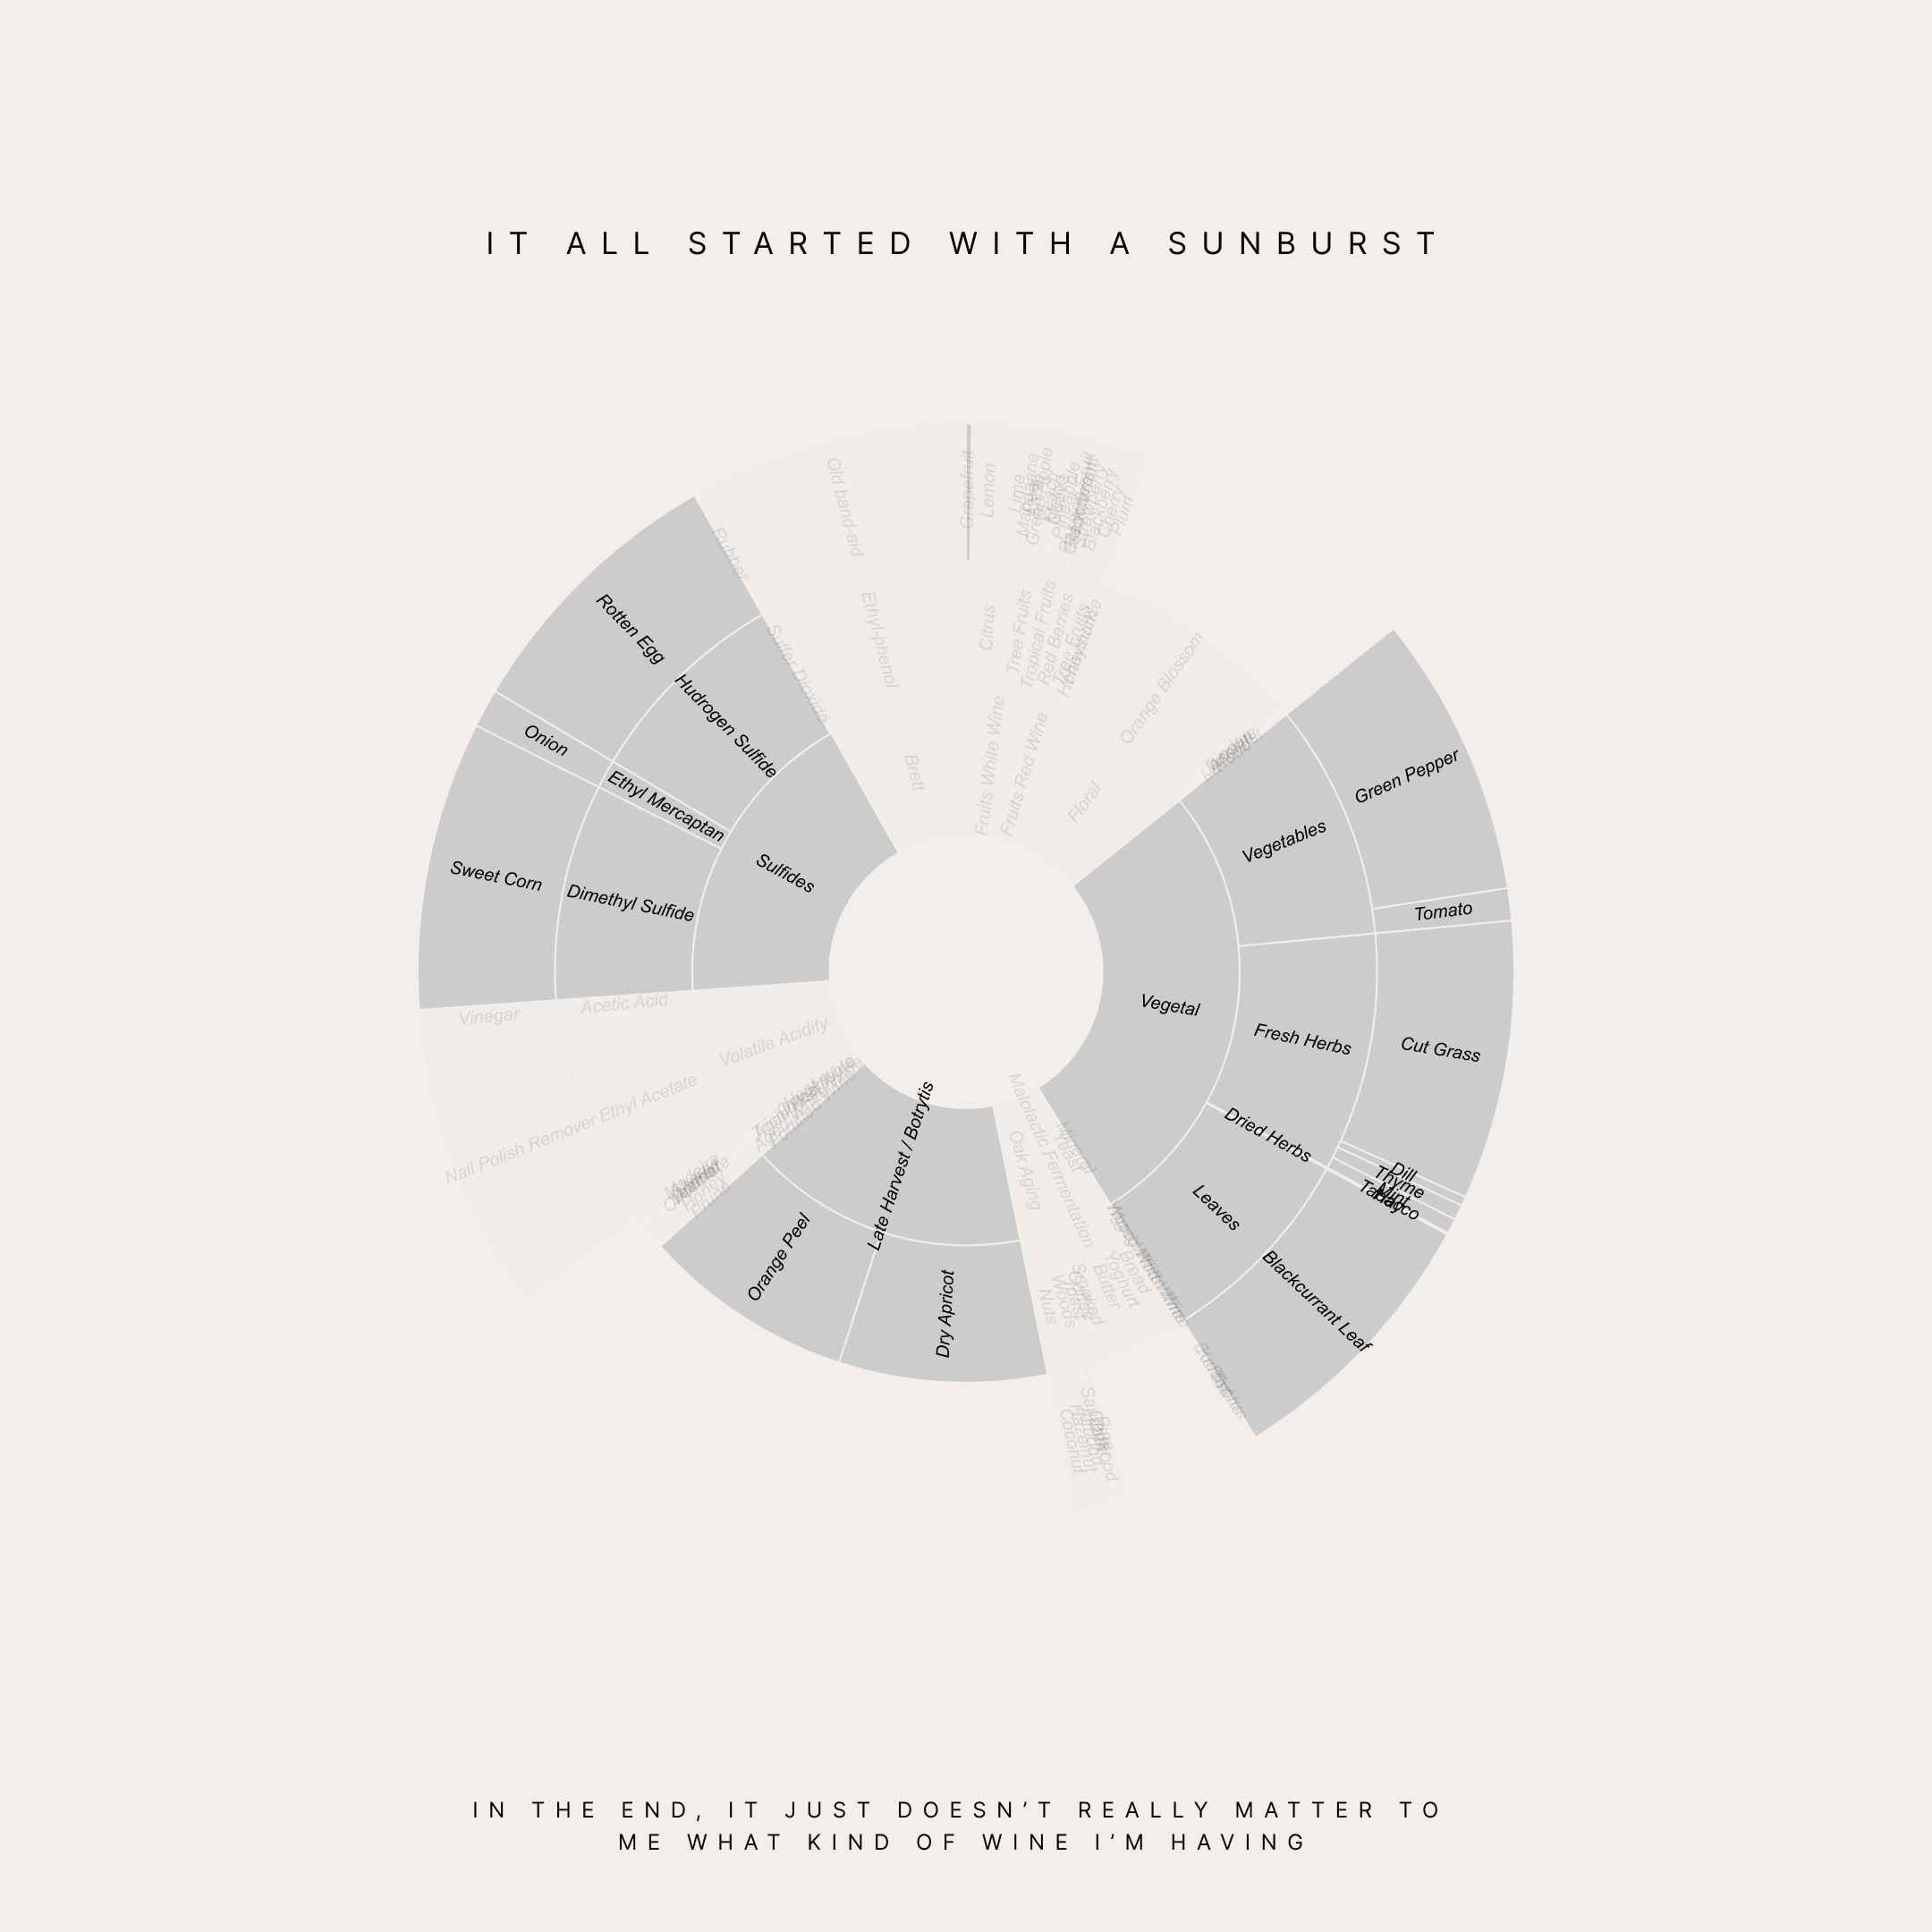
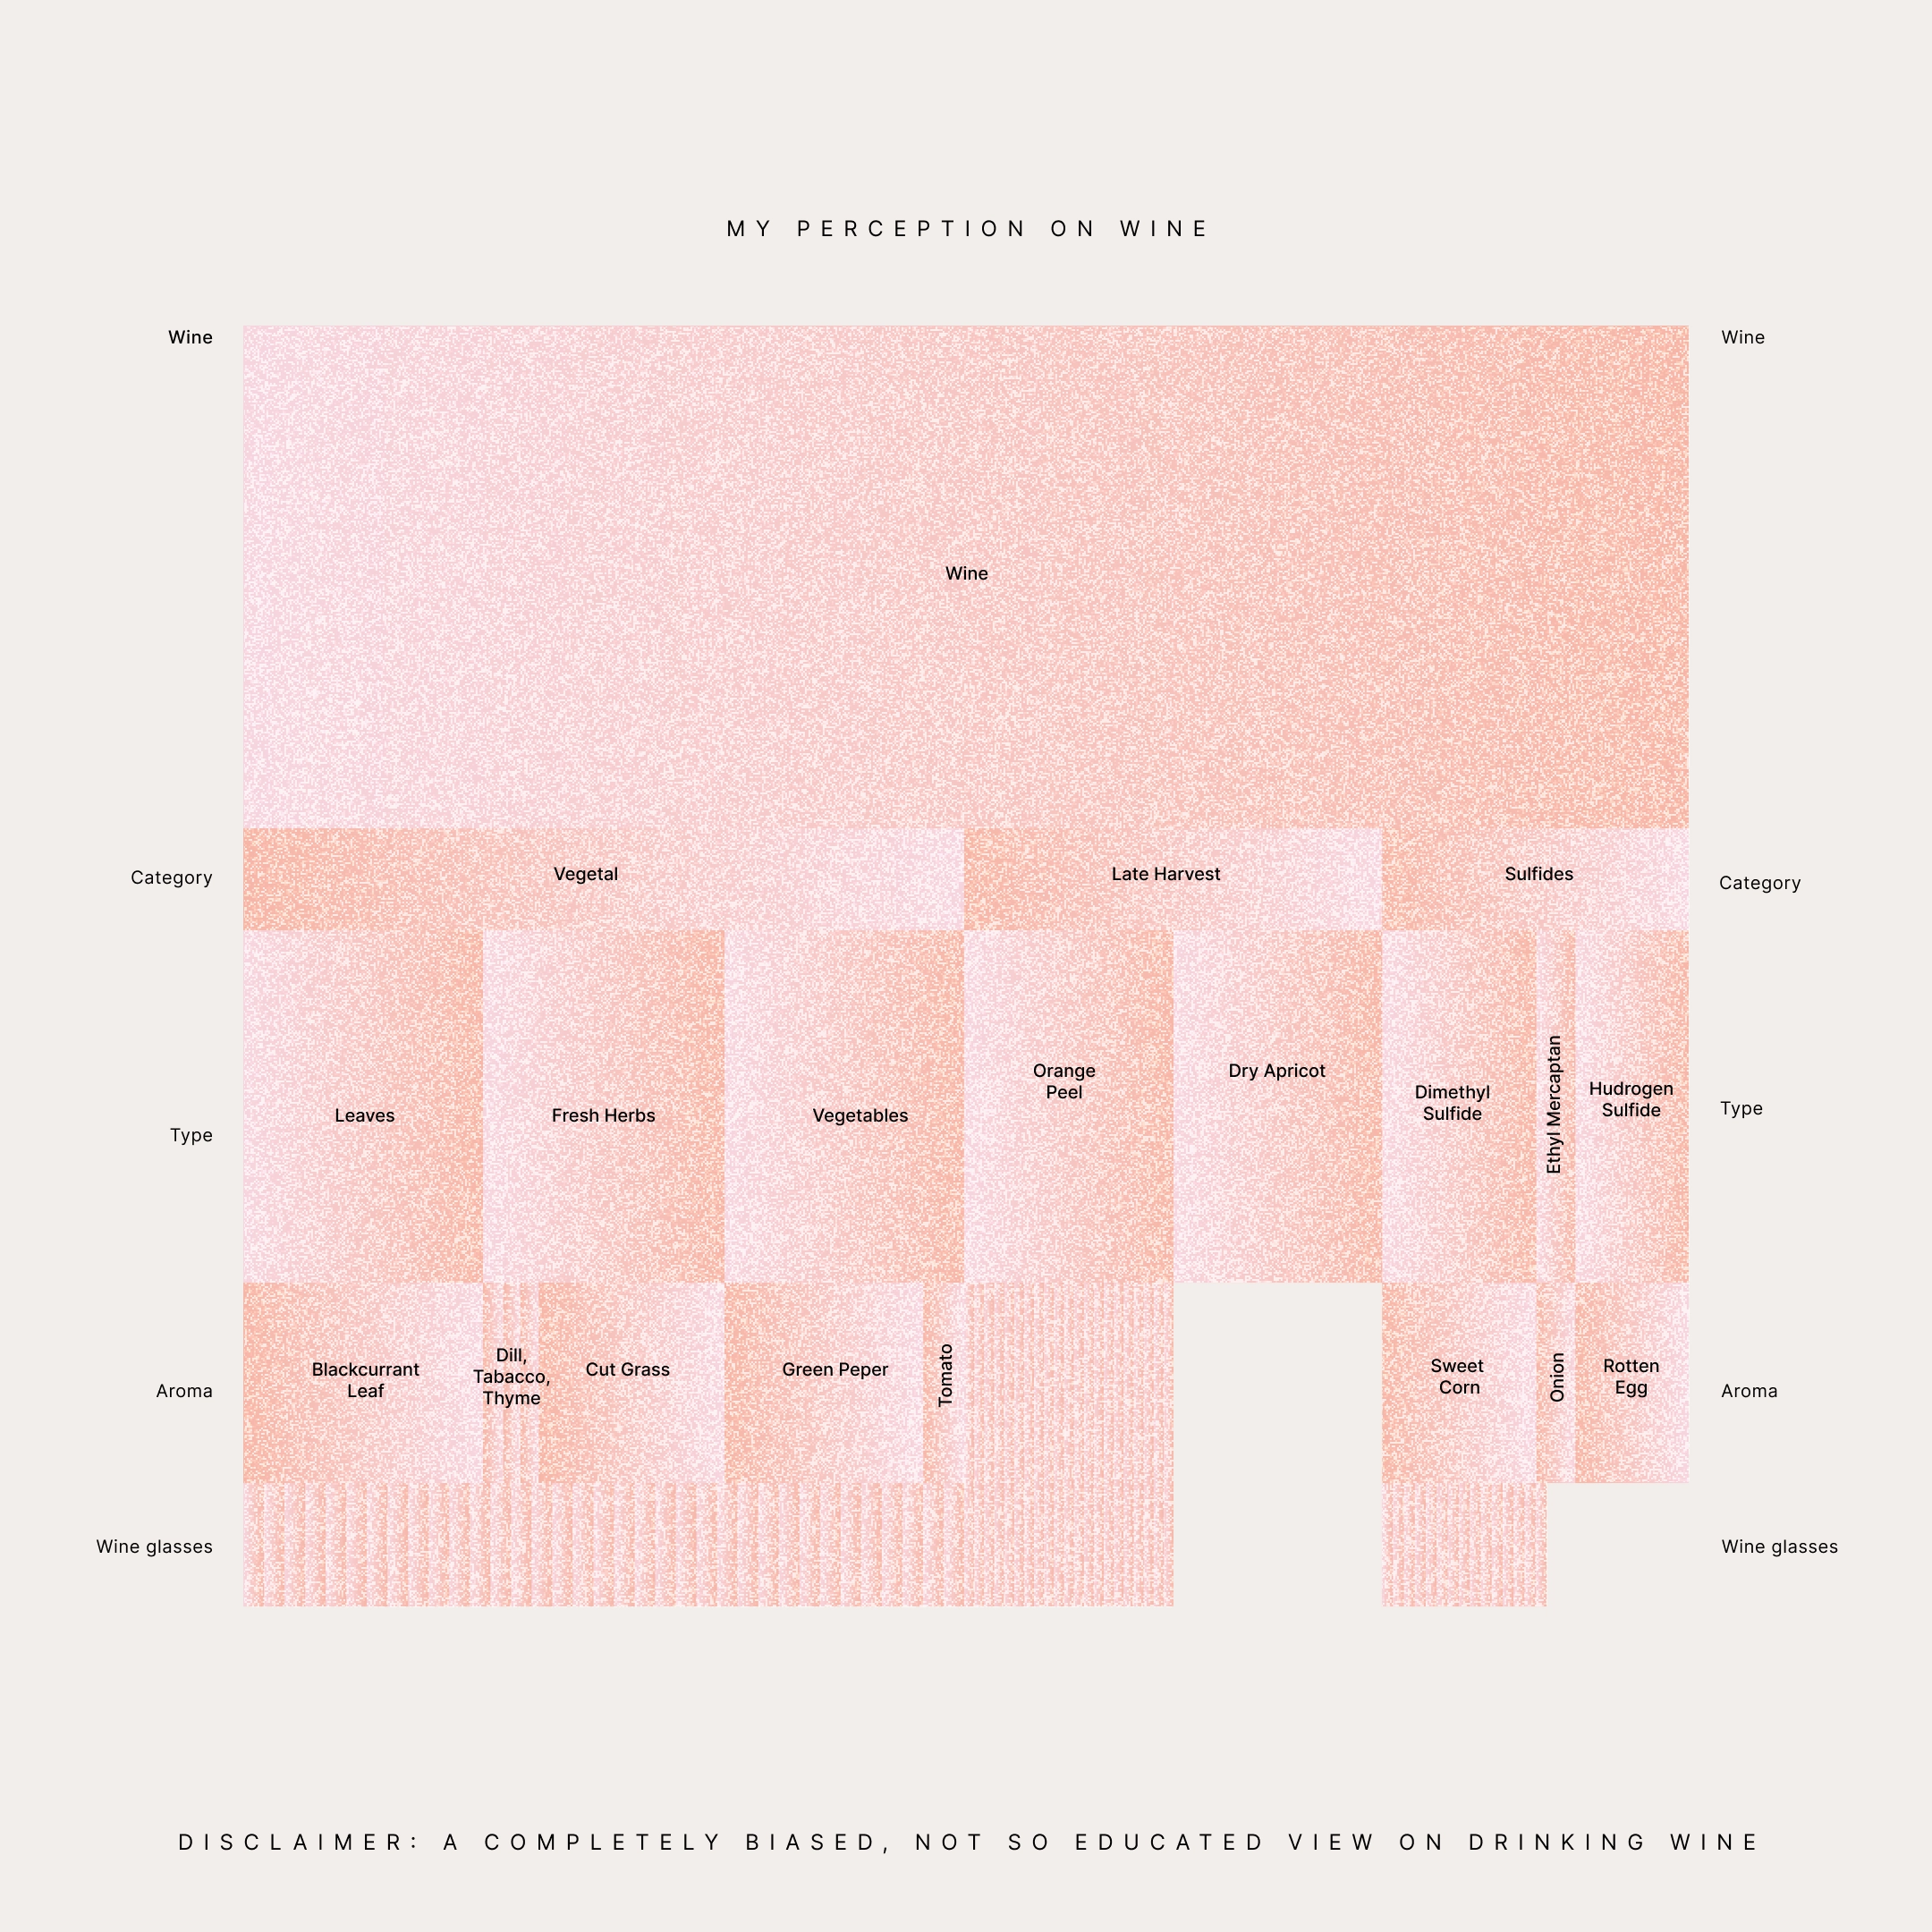
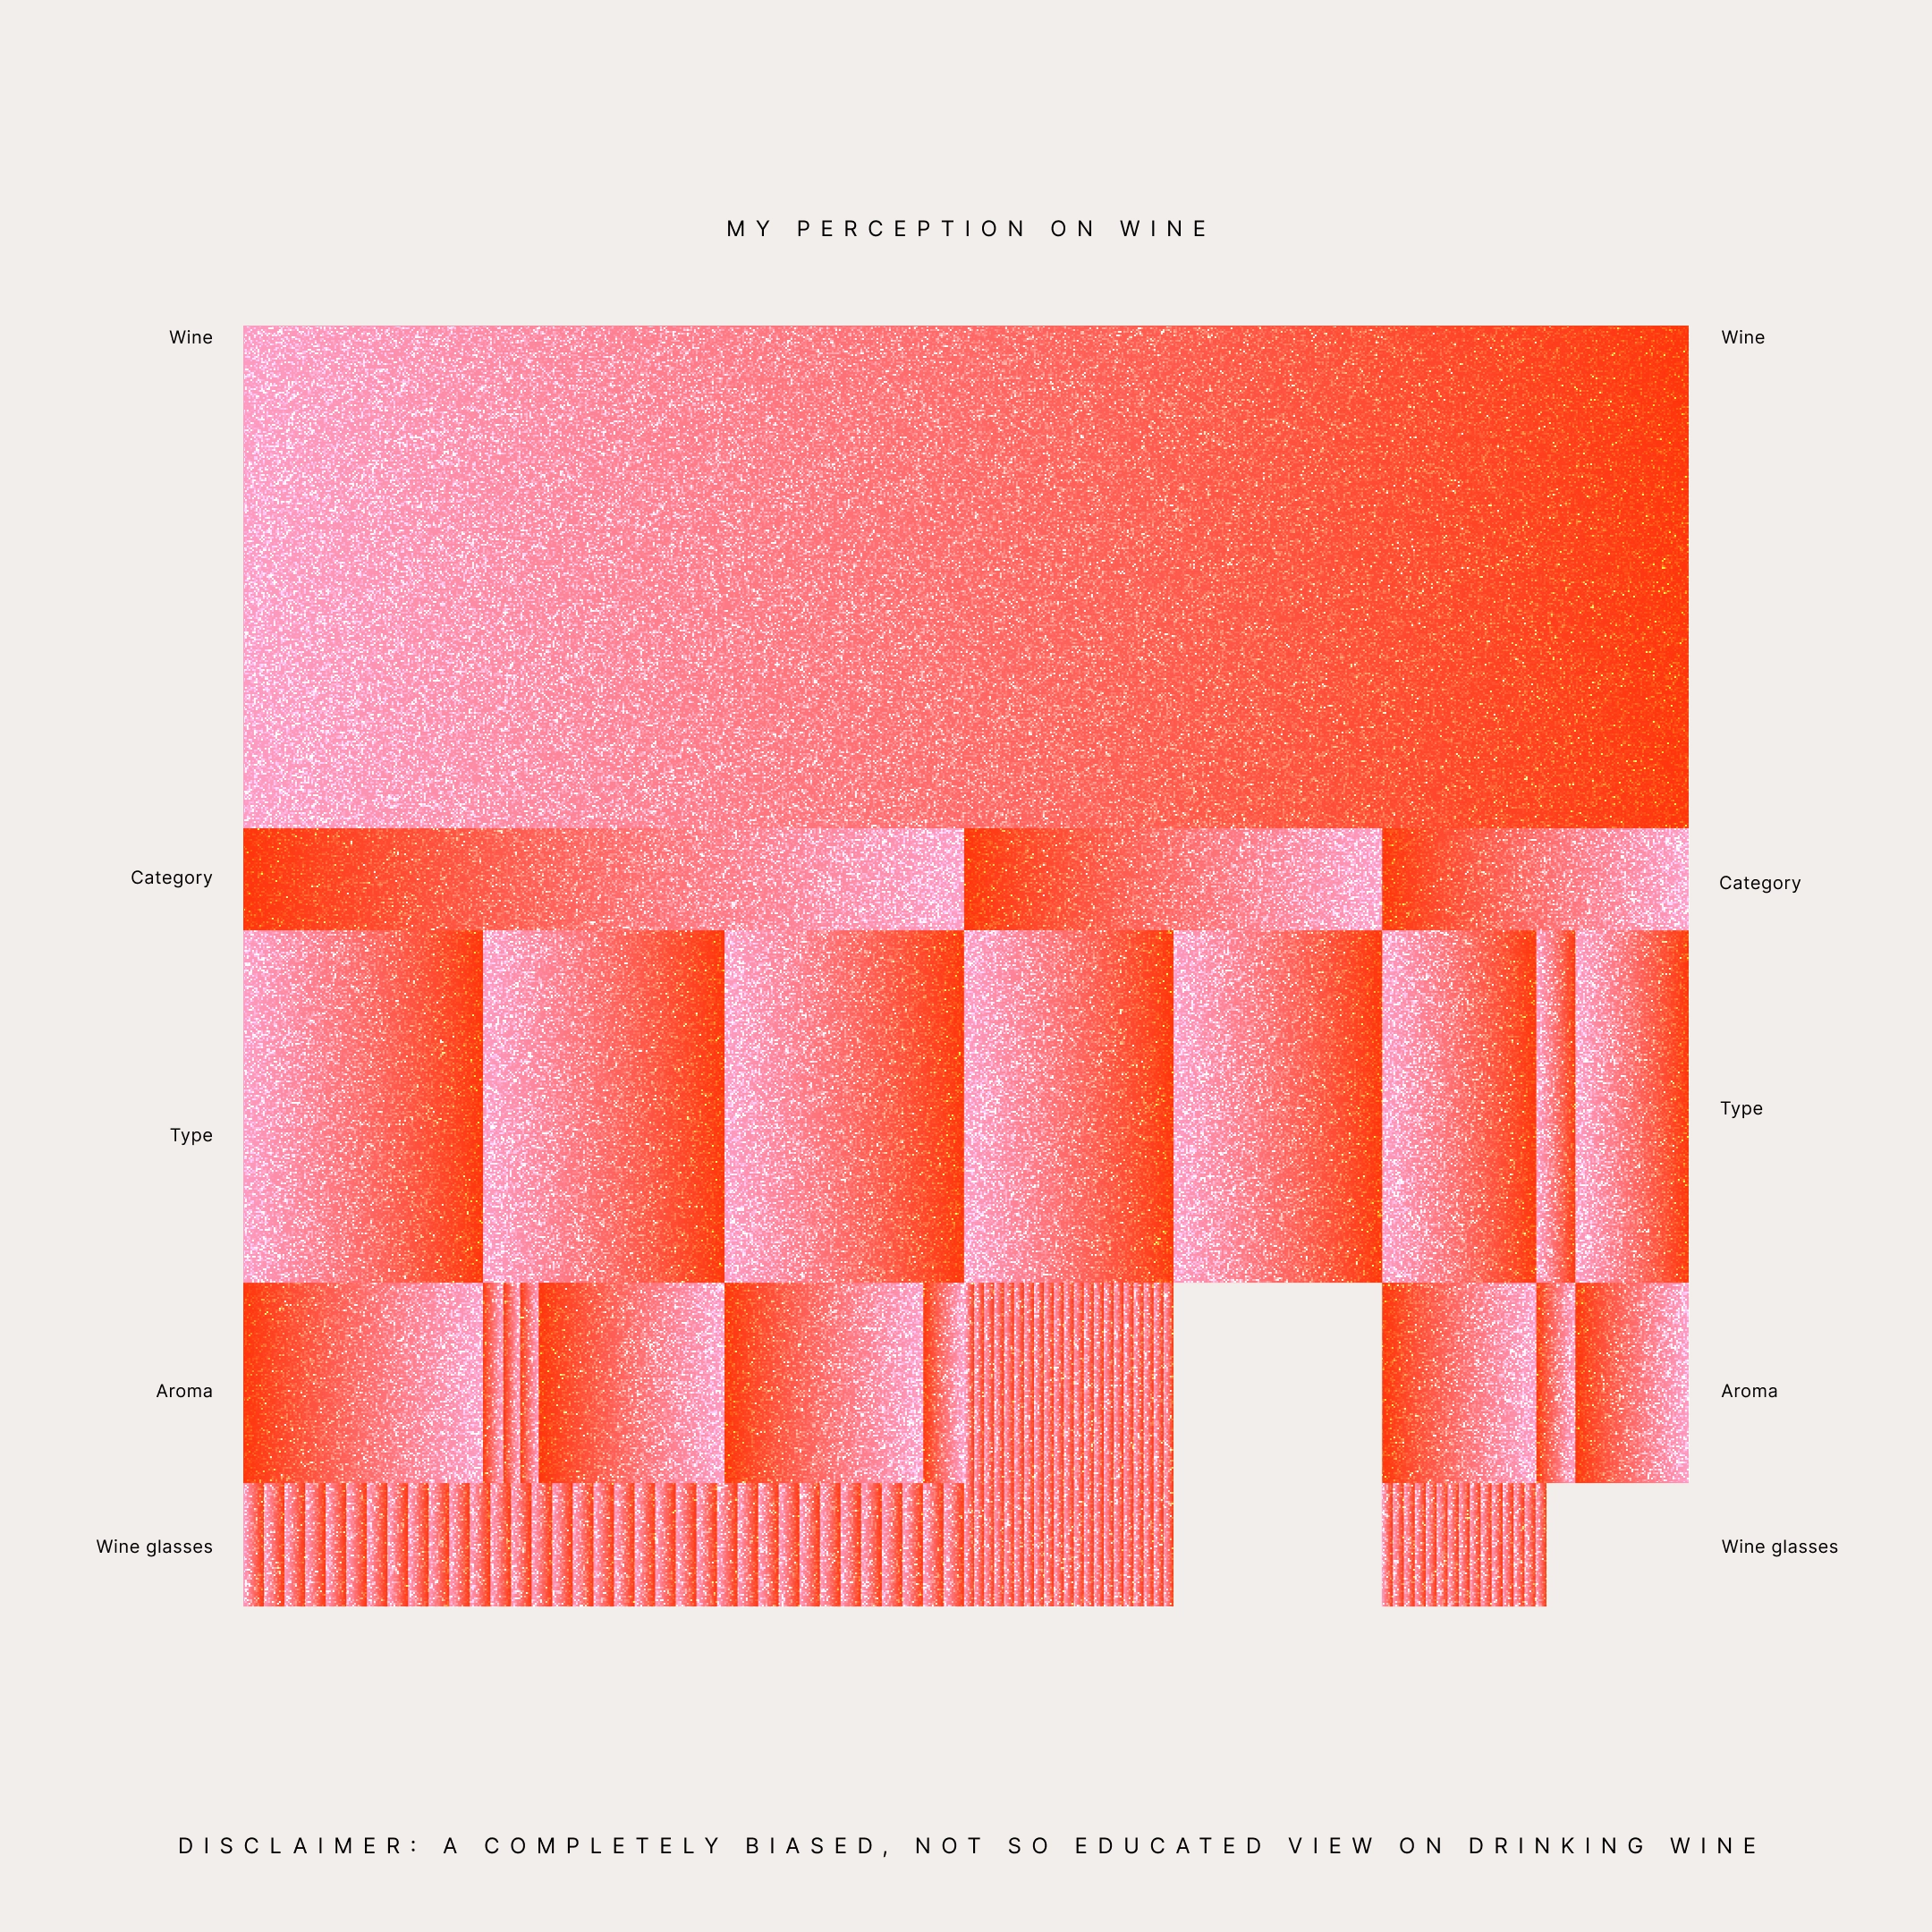
My perception on wine: A completely biased, not so educated view on drinking wine. Also got some inspo in pinterest for this one.
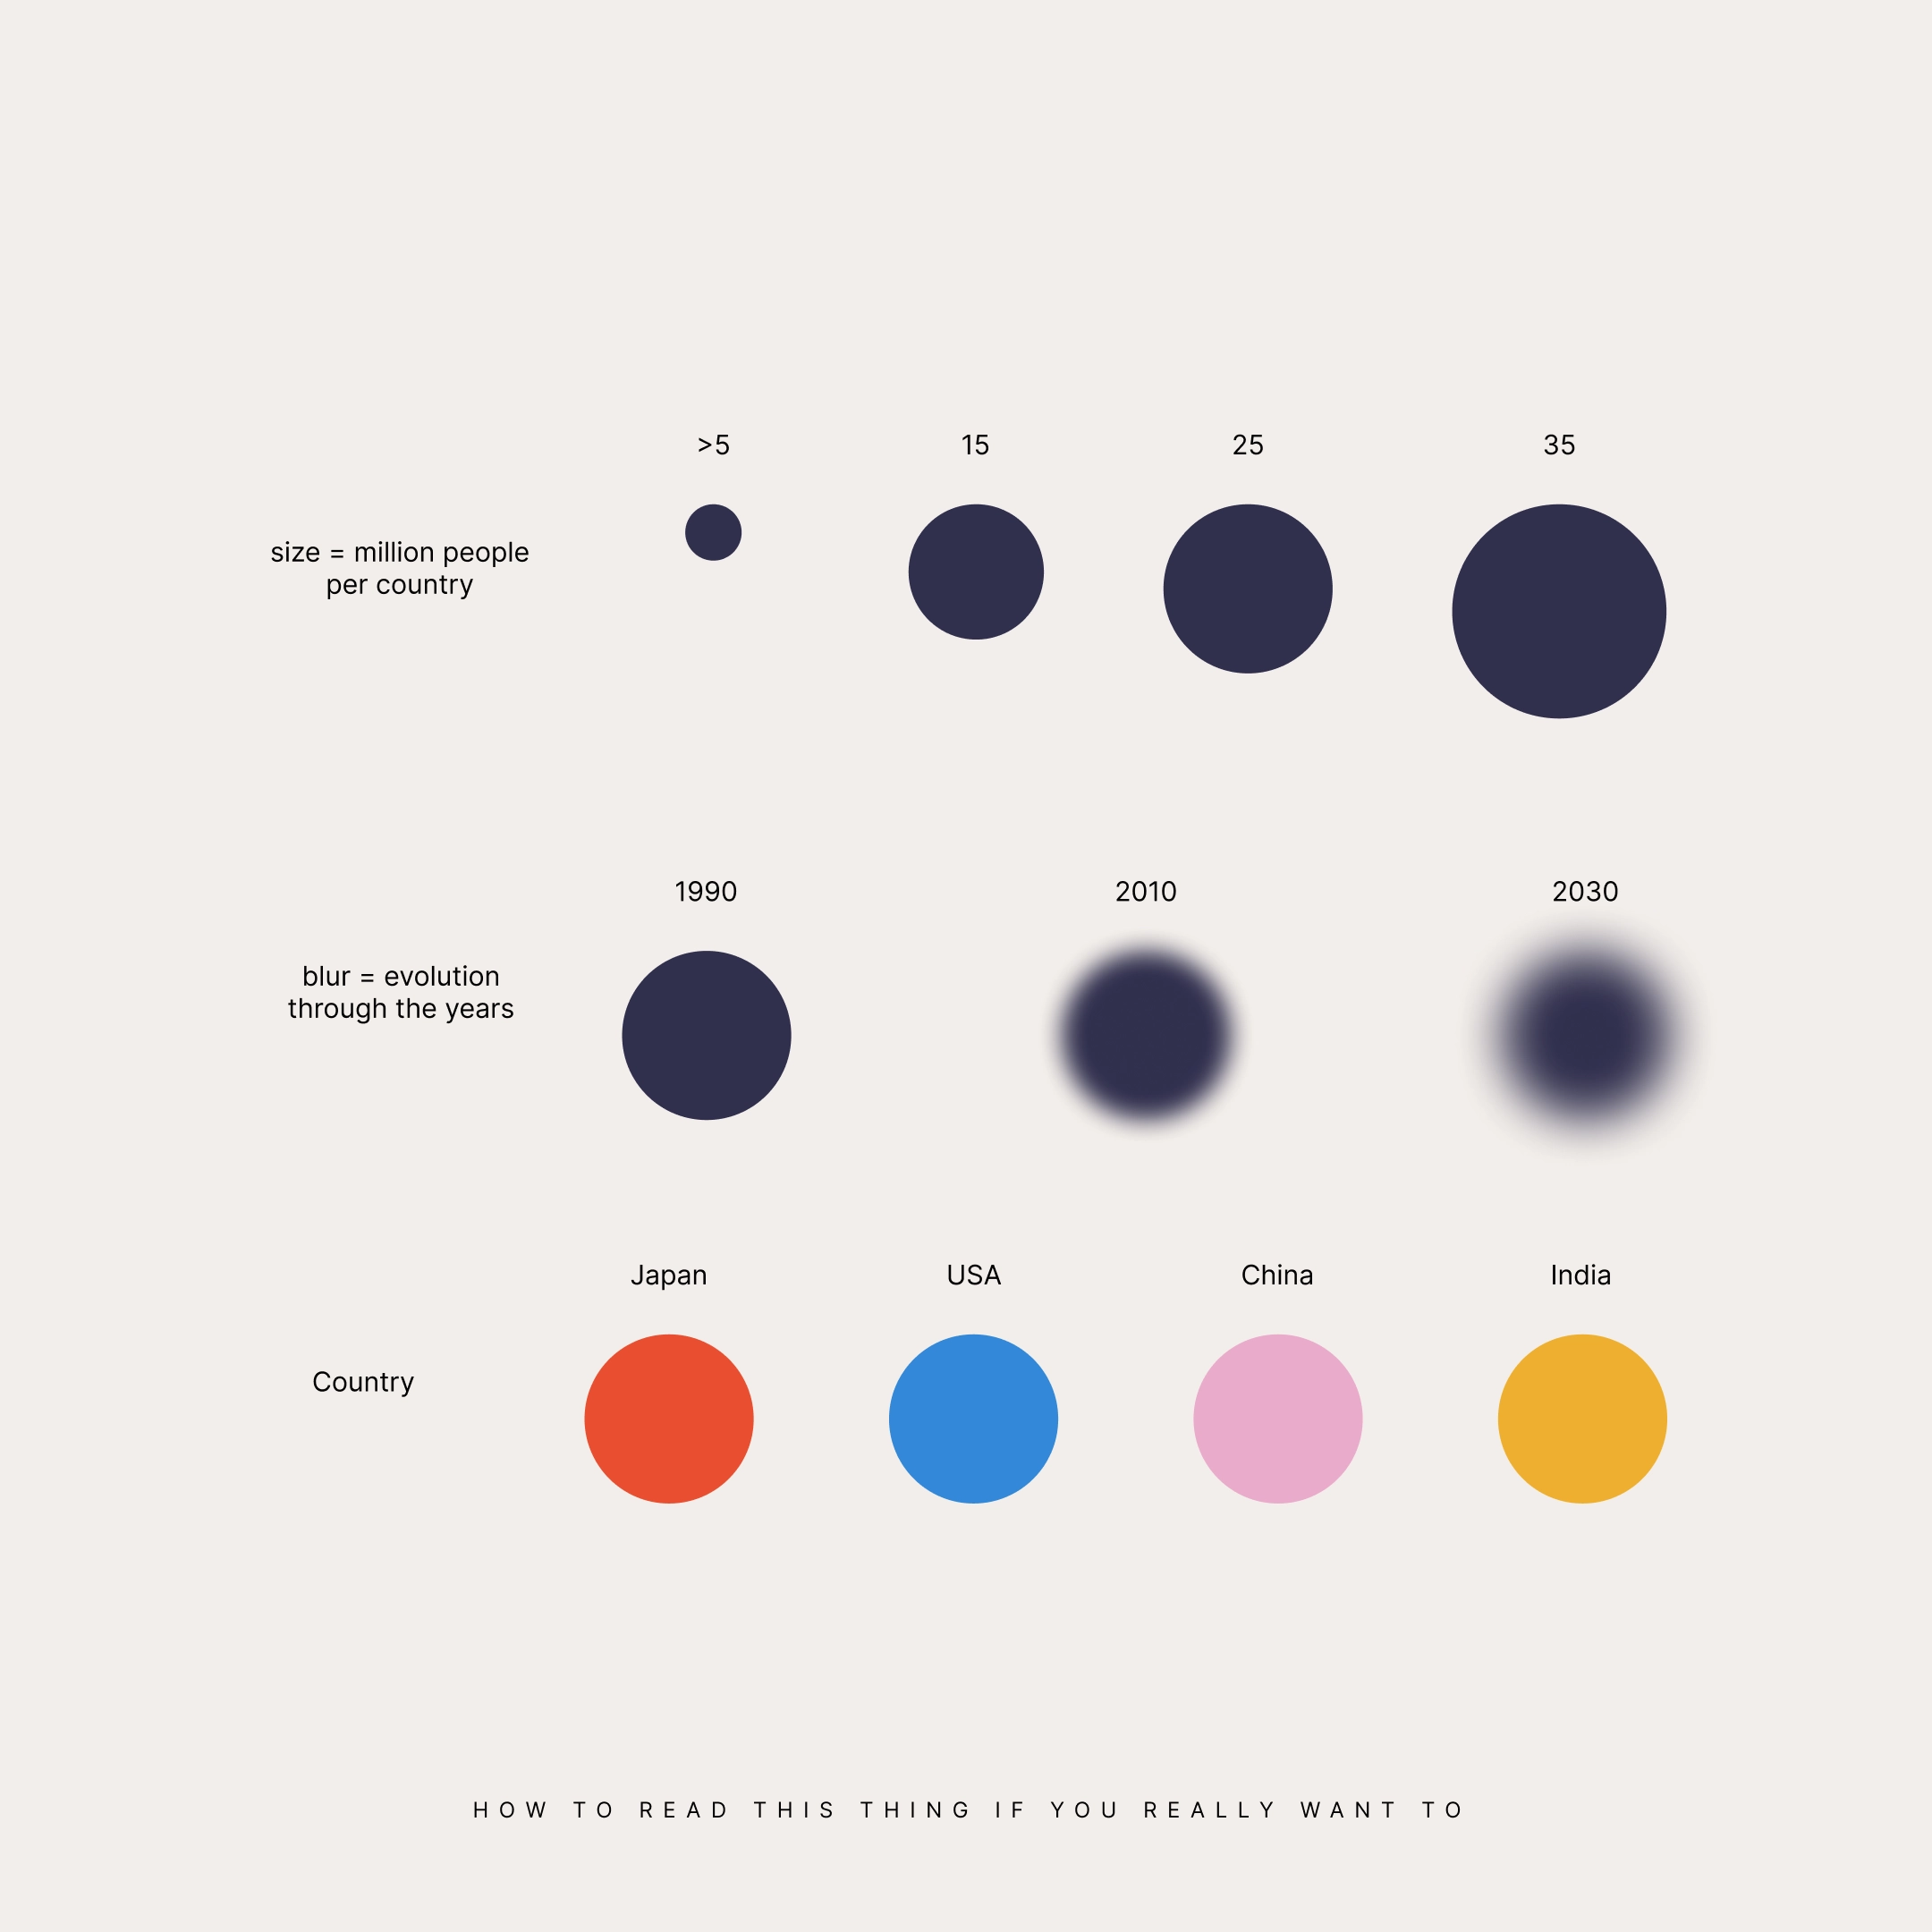
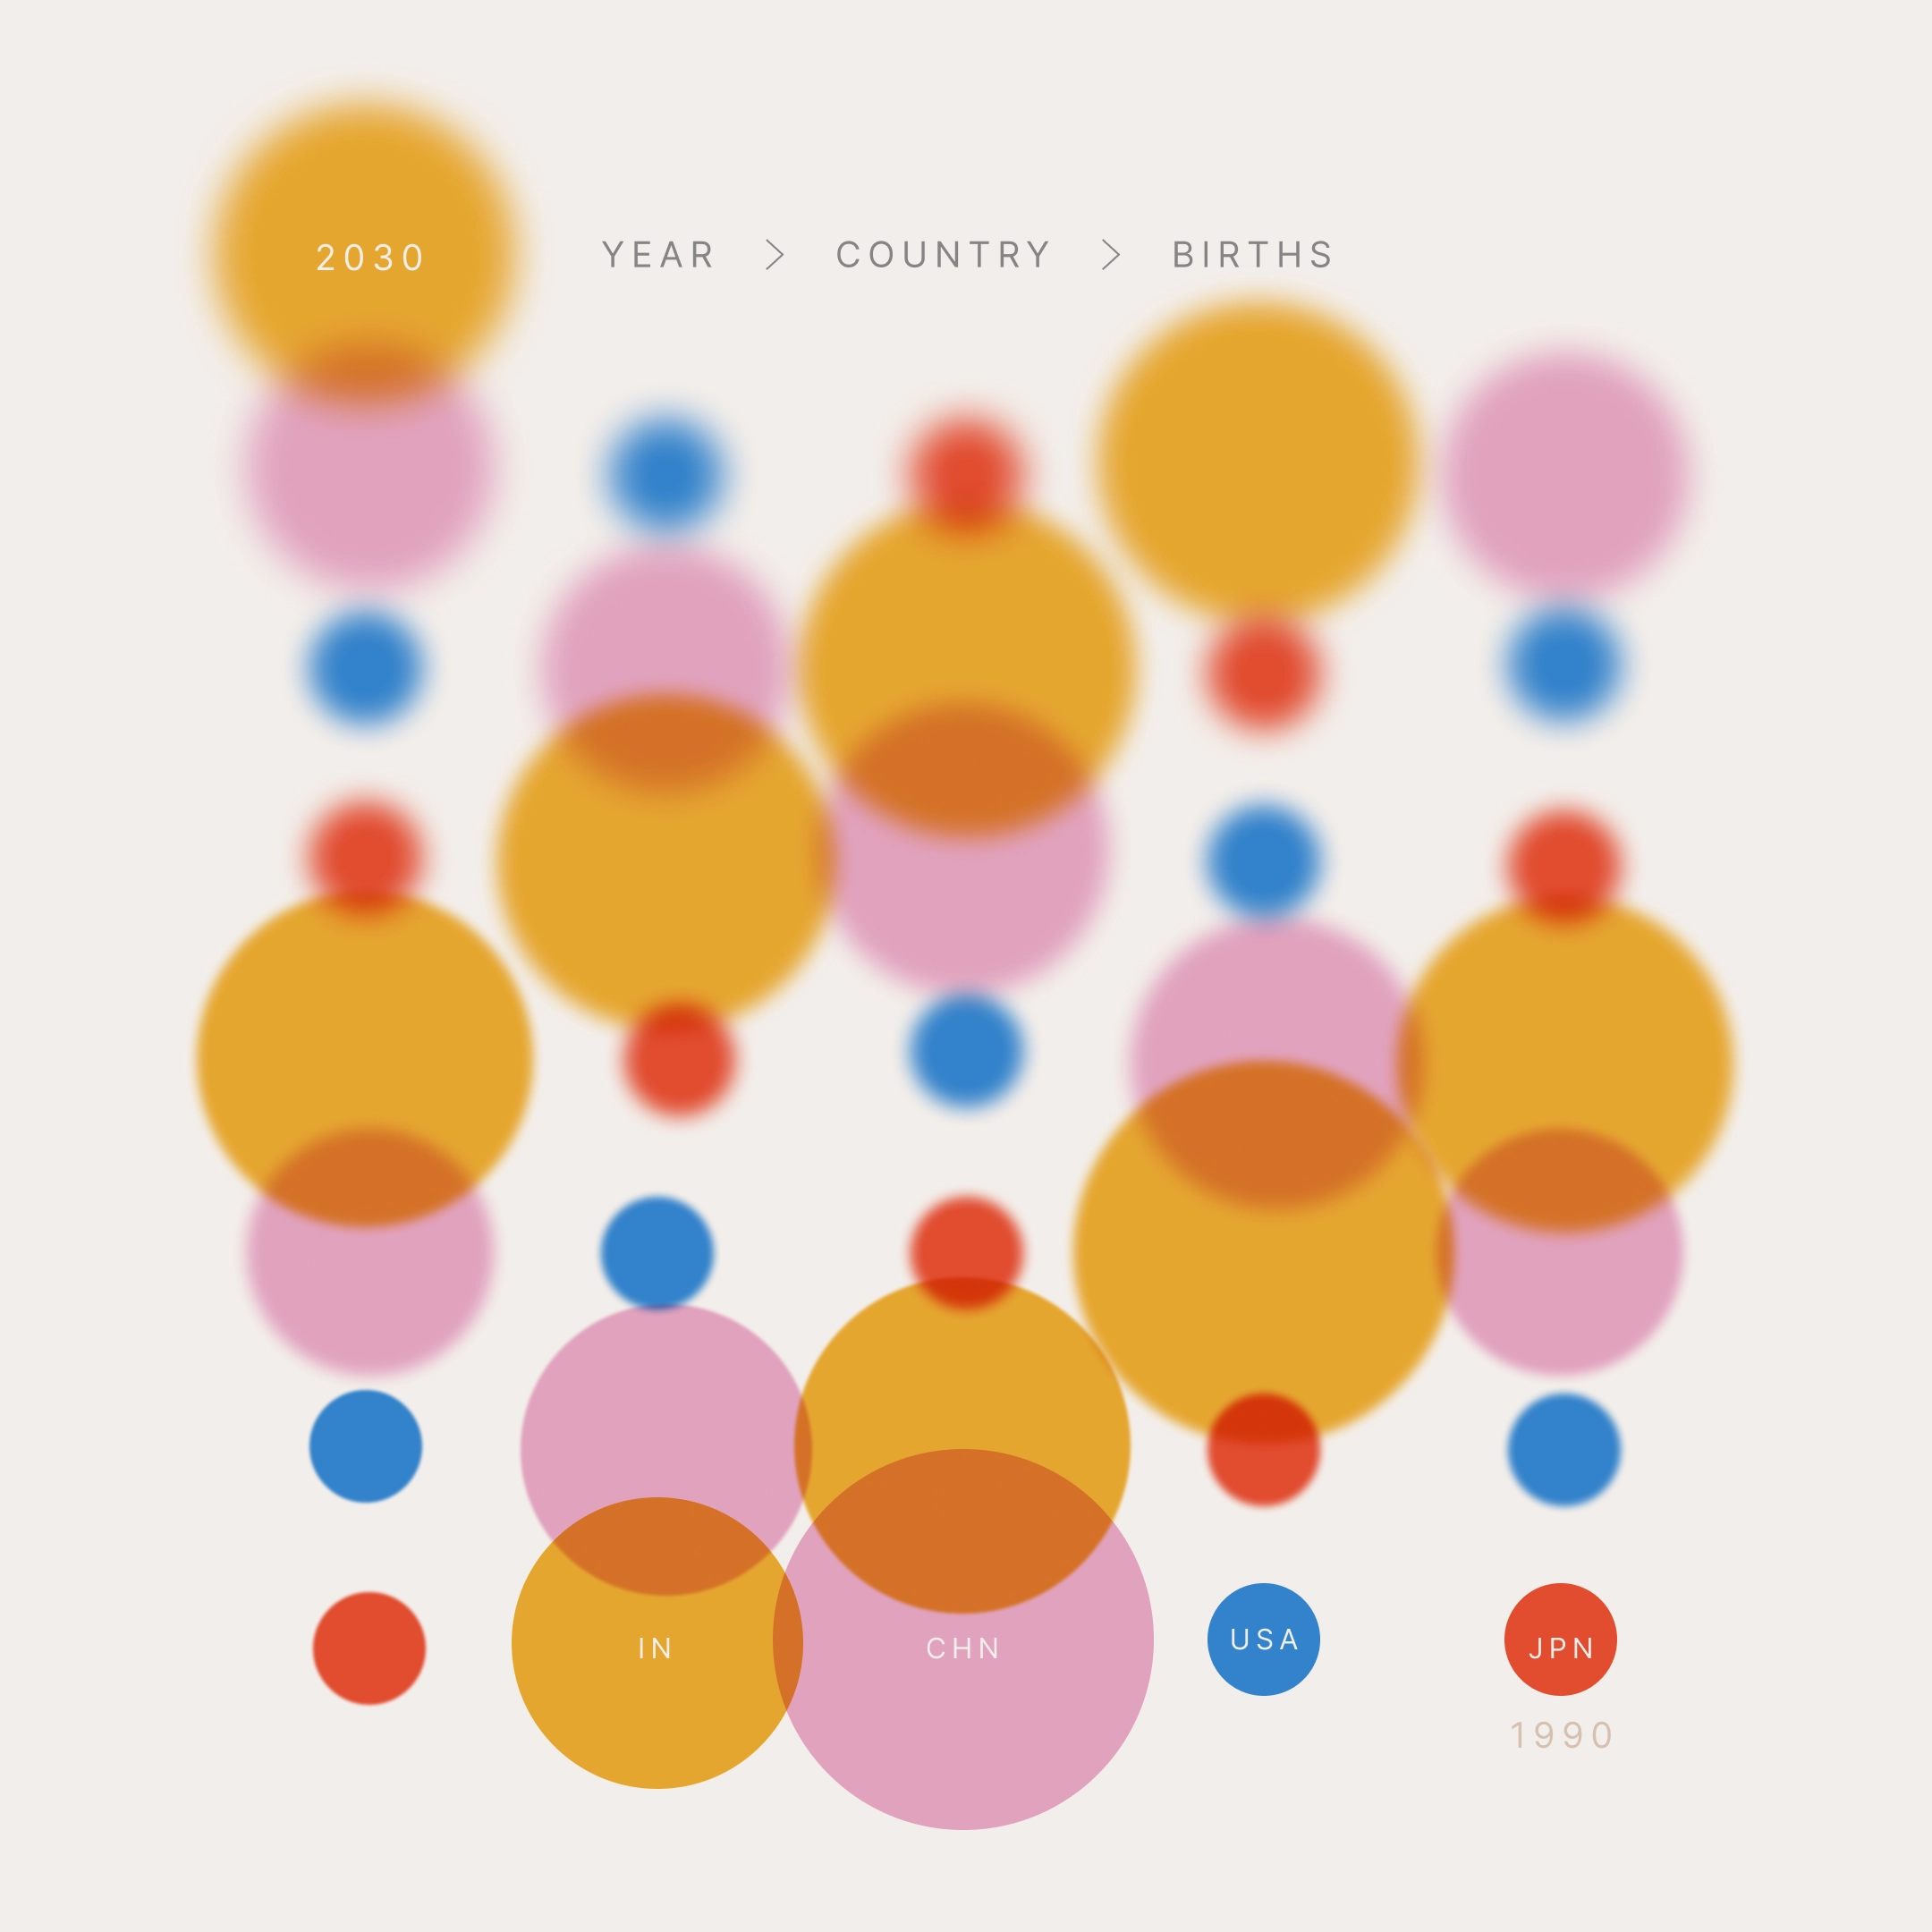
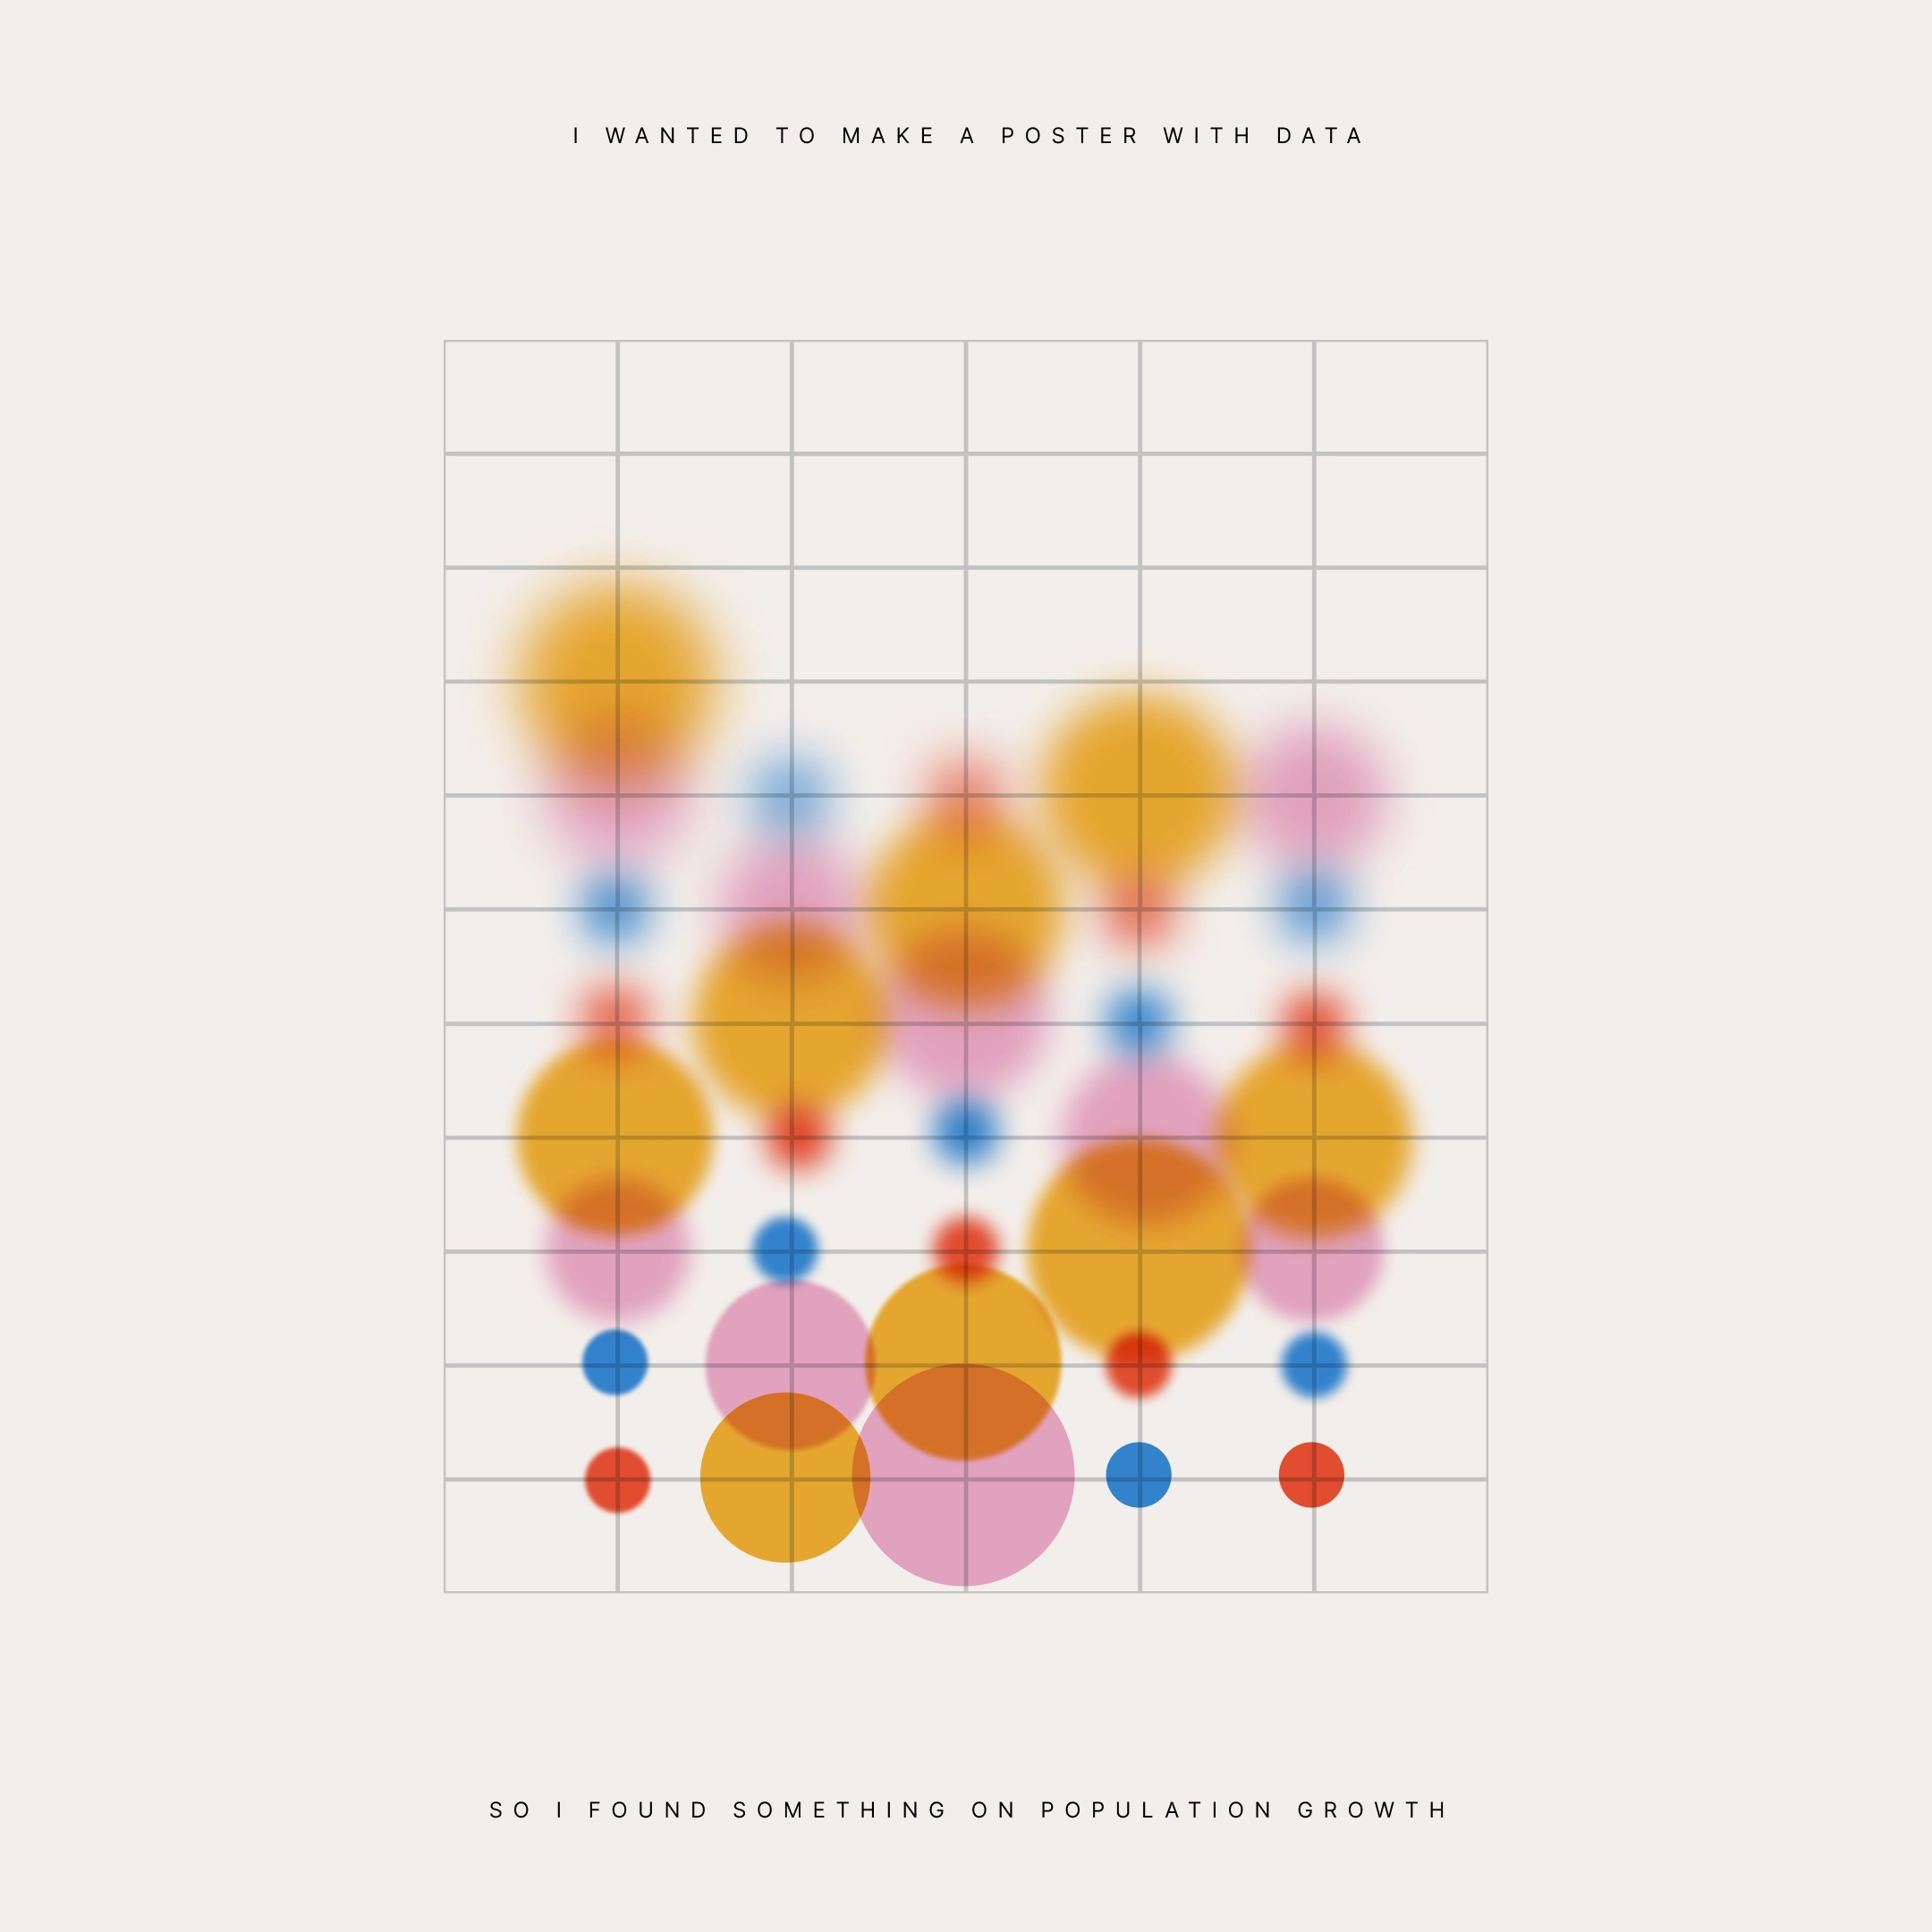
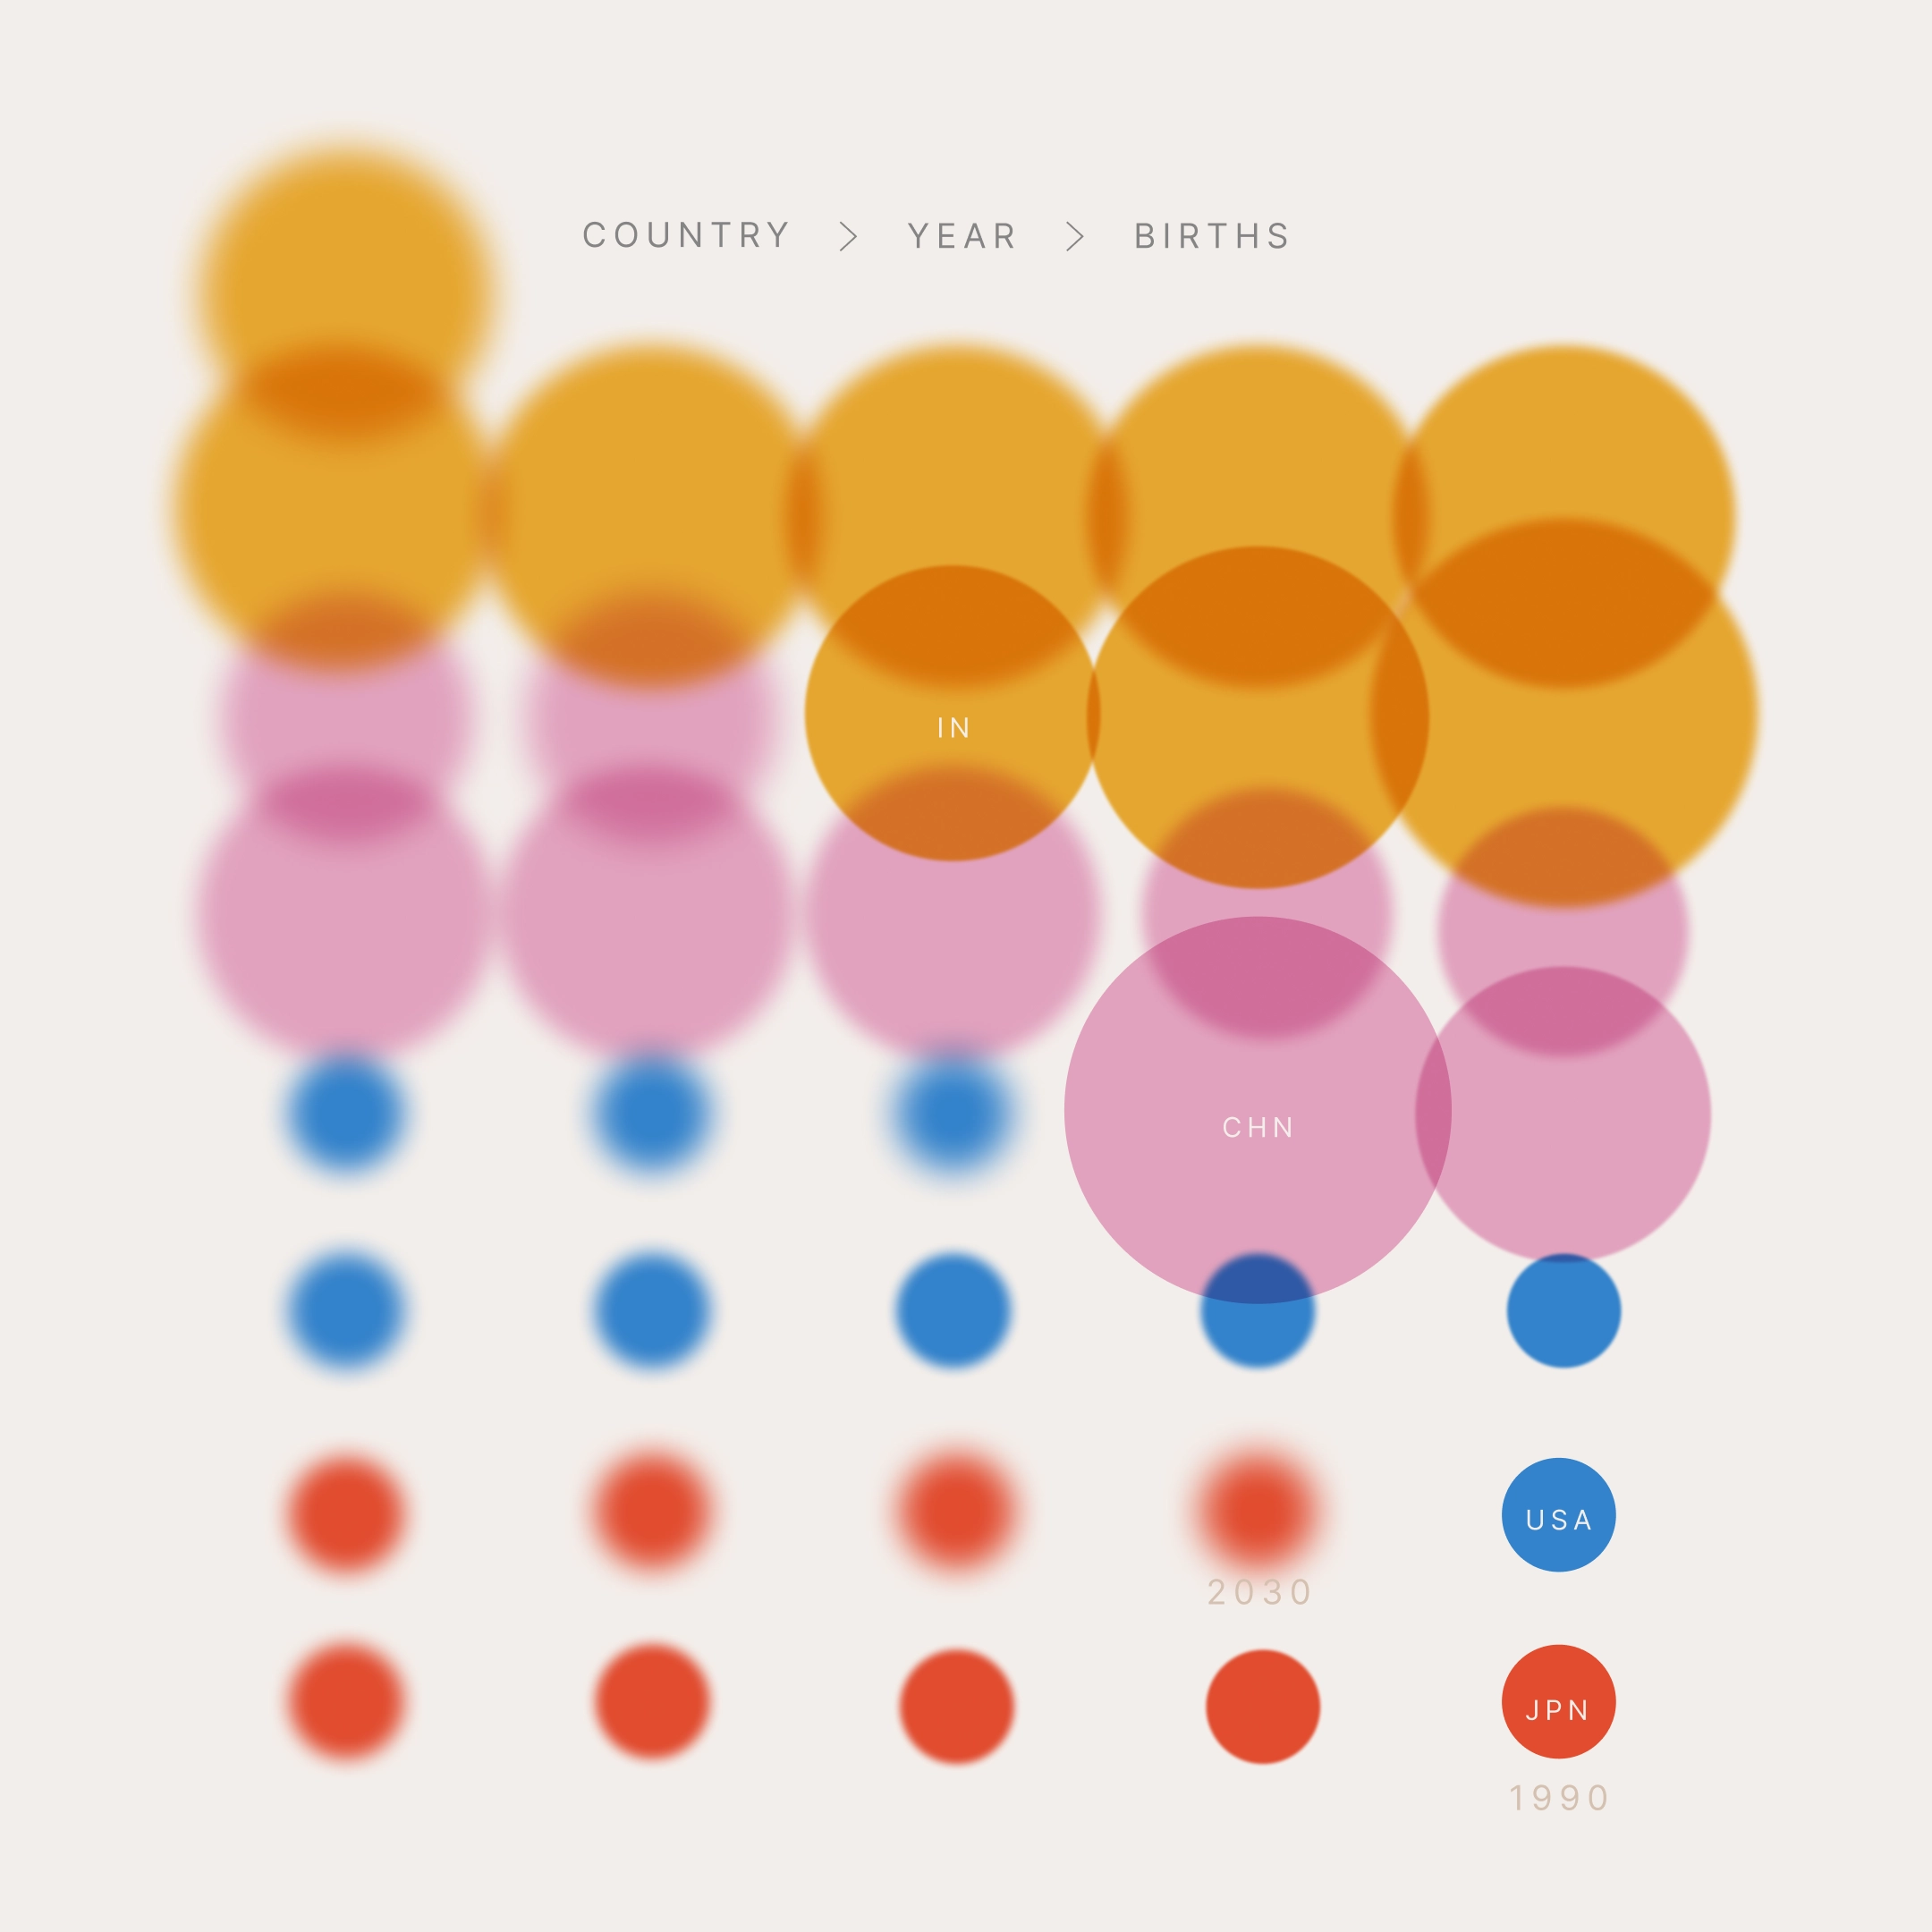
I wanted to make a poster with data so I found something about population growth.
Around this time I started having fun, about 6 months after I started maybe?
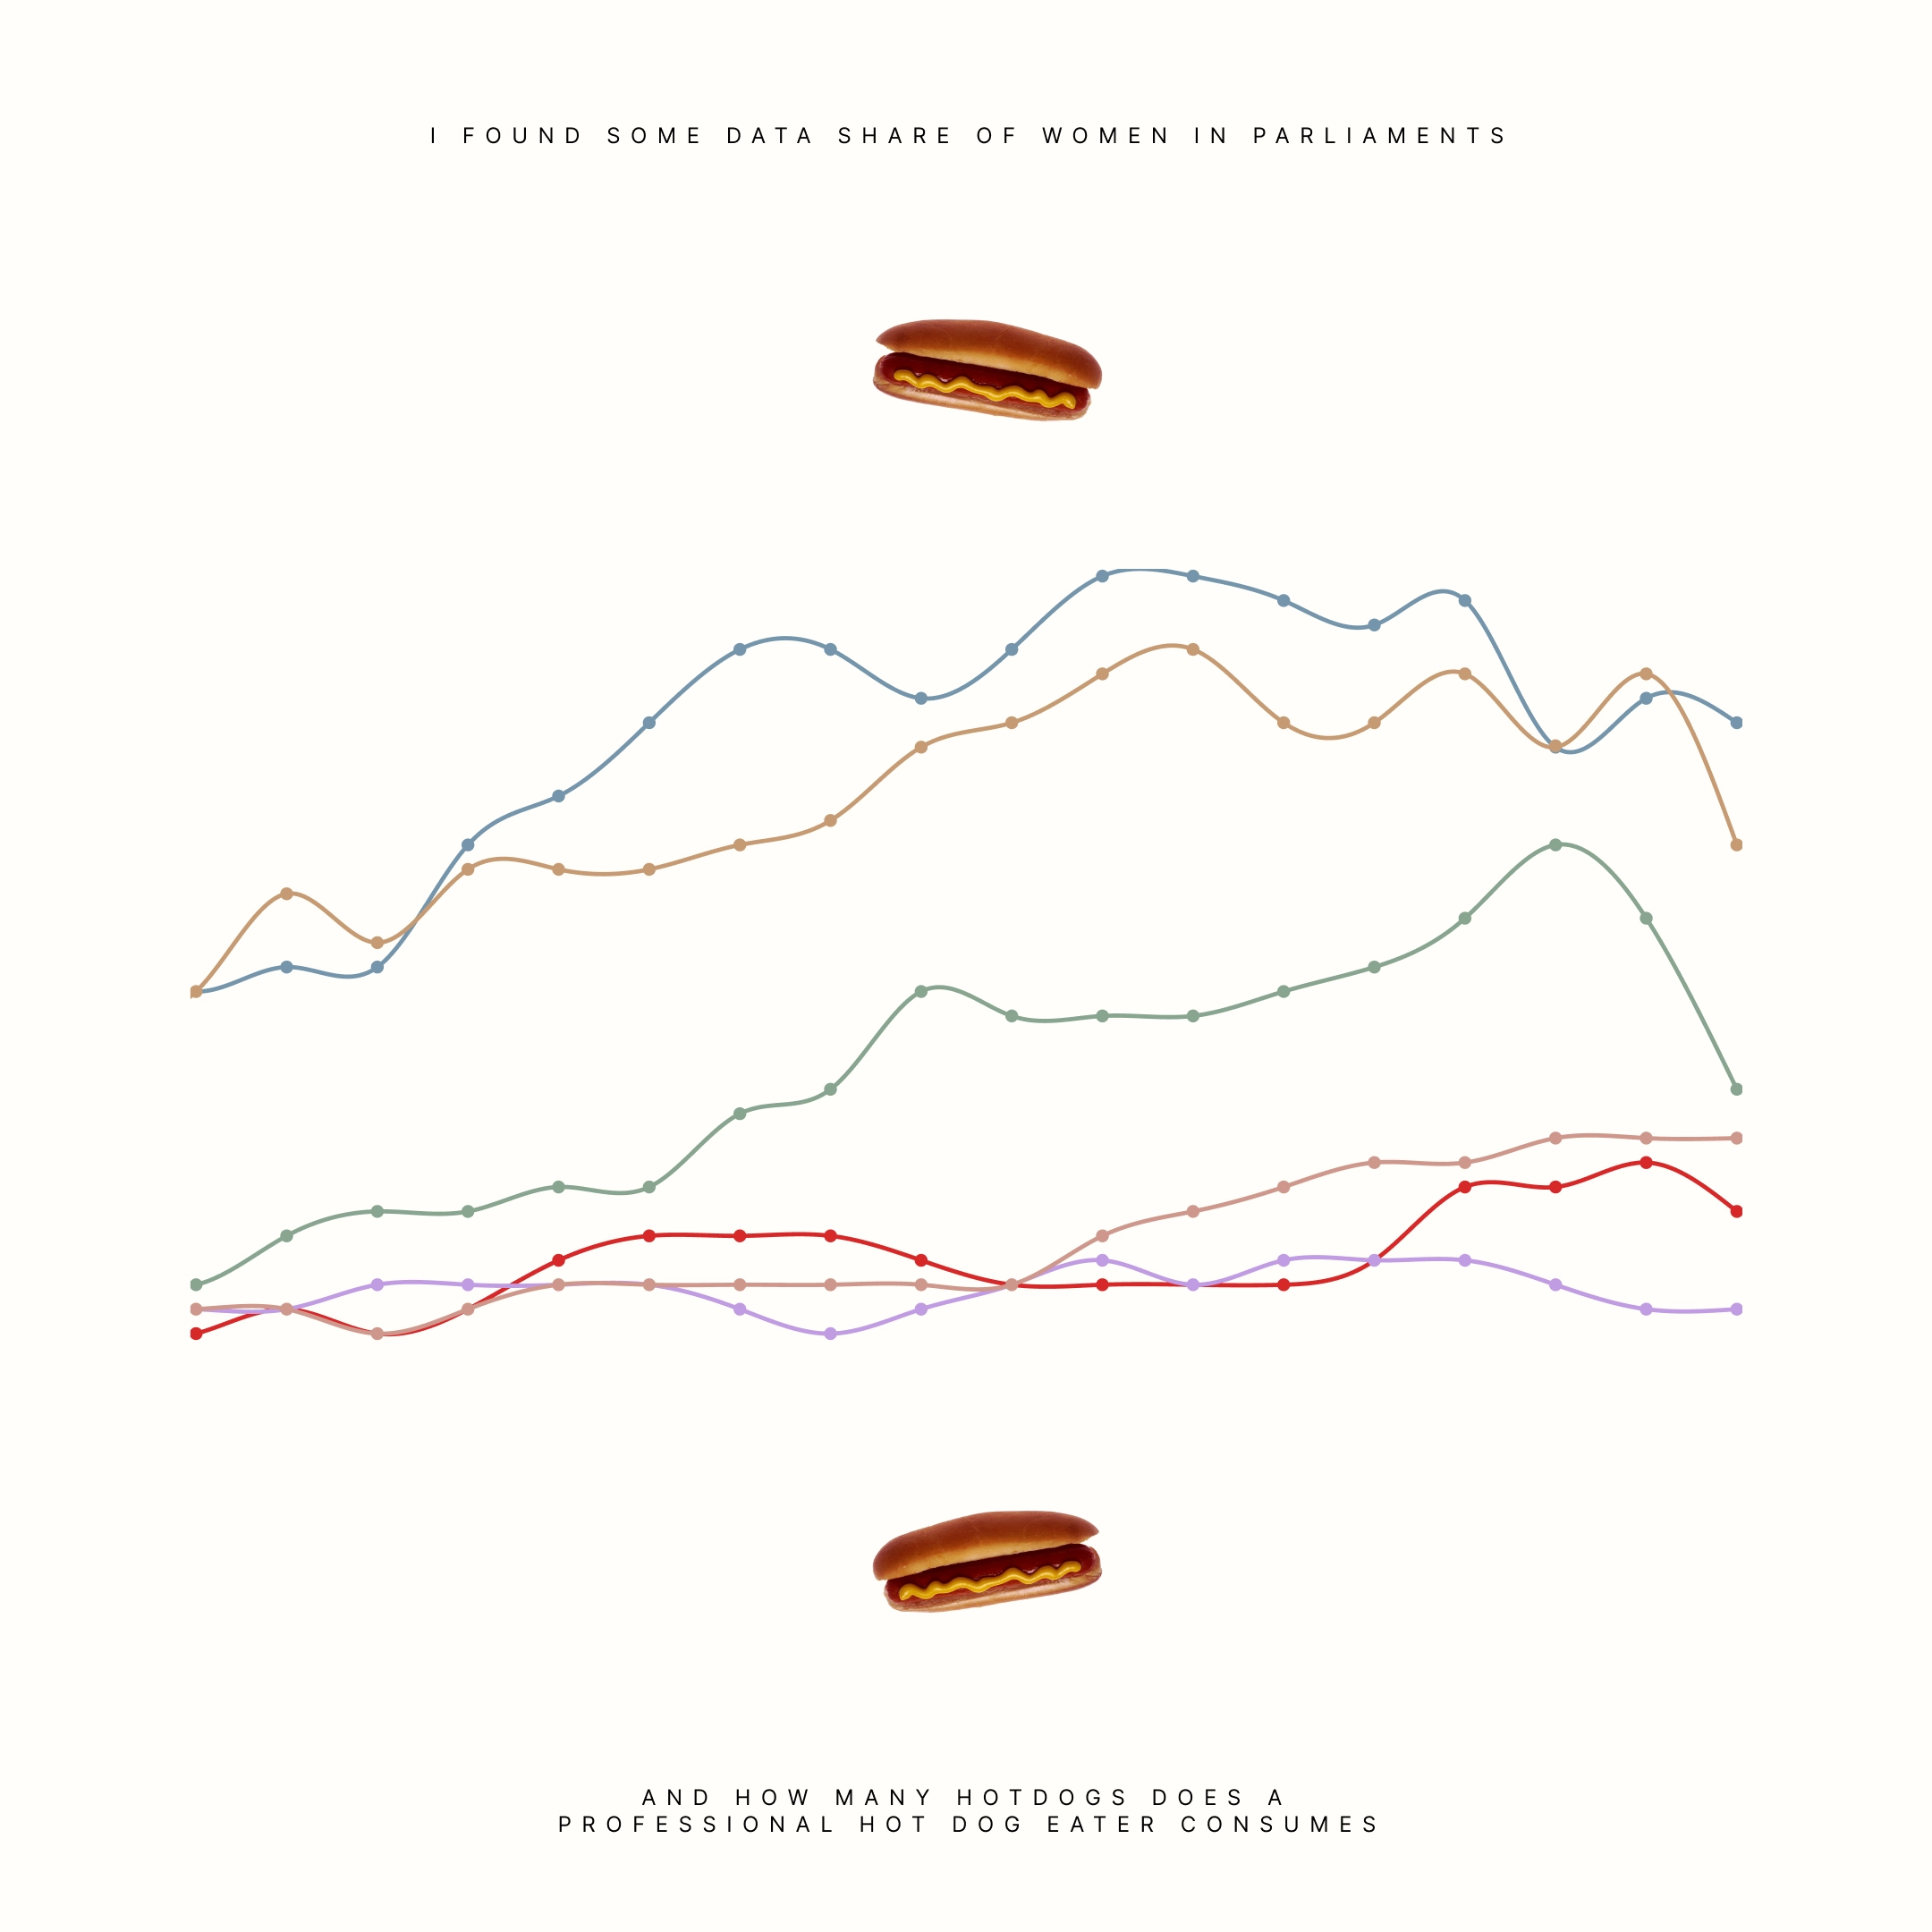
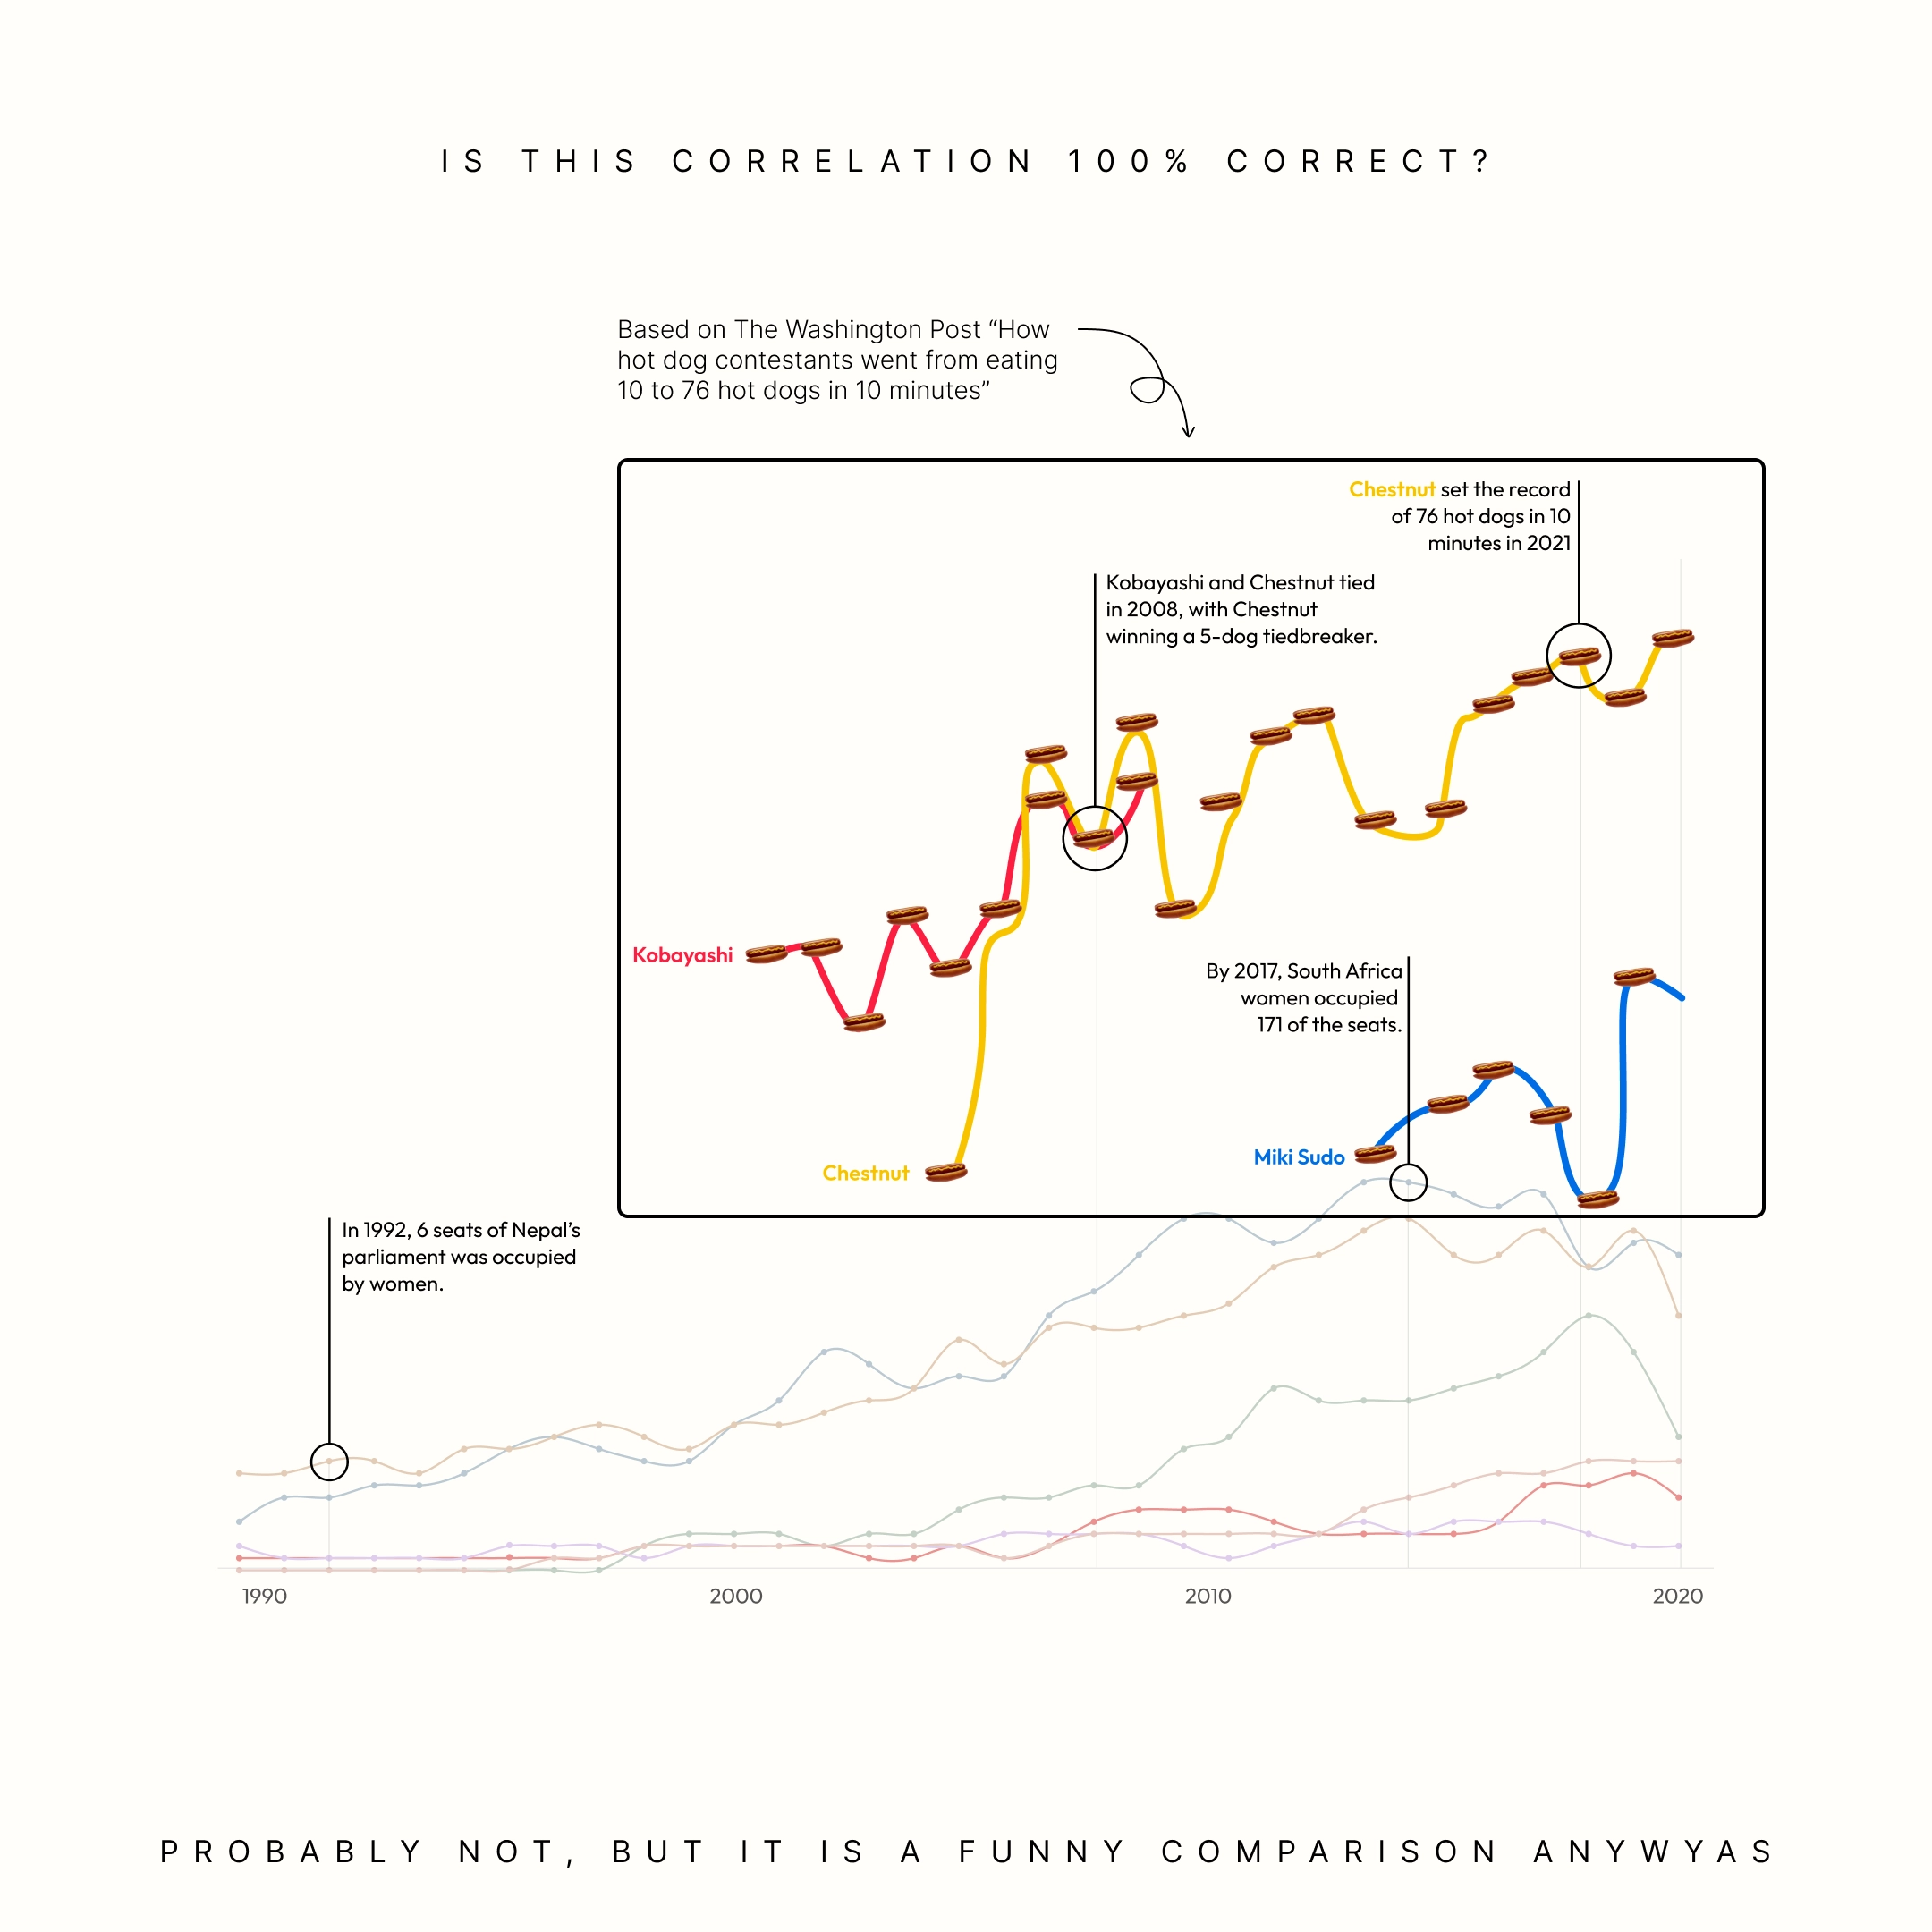
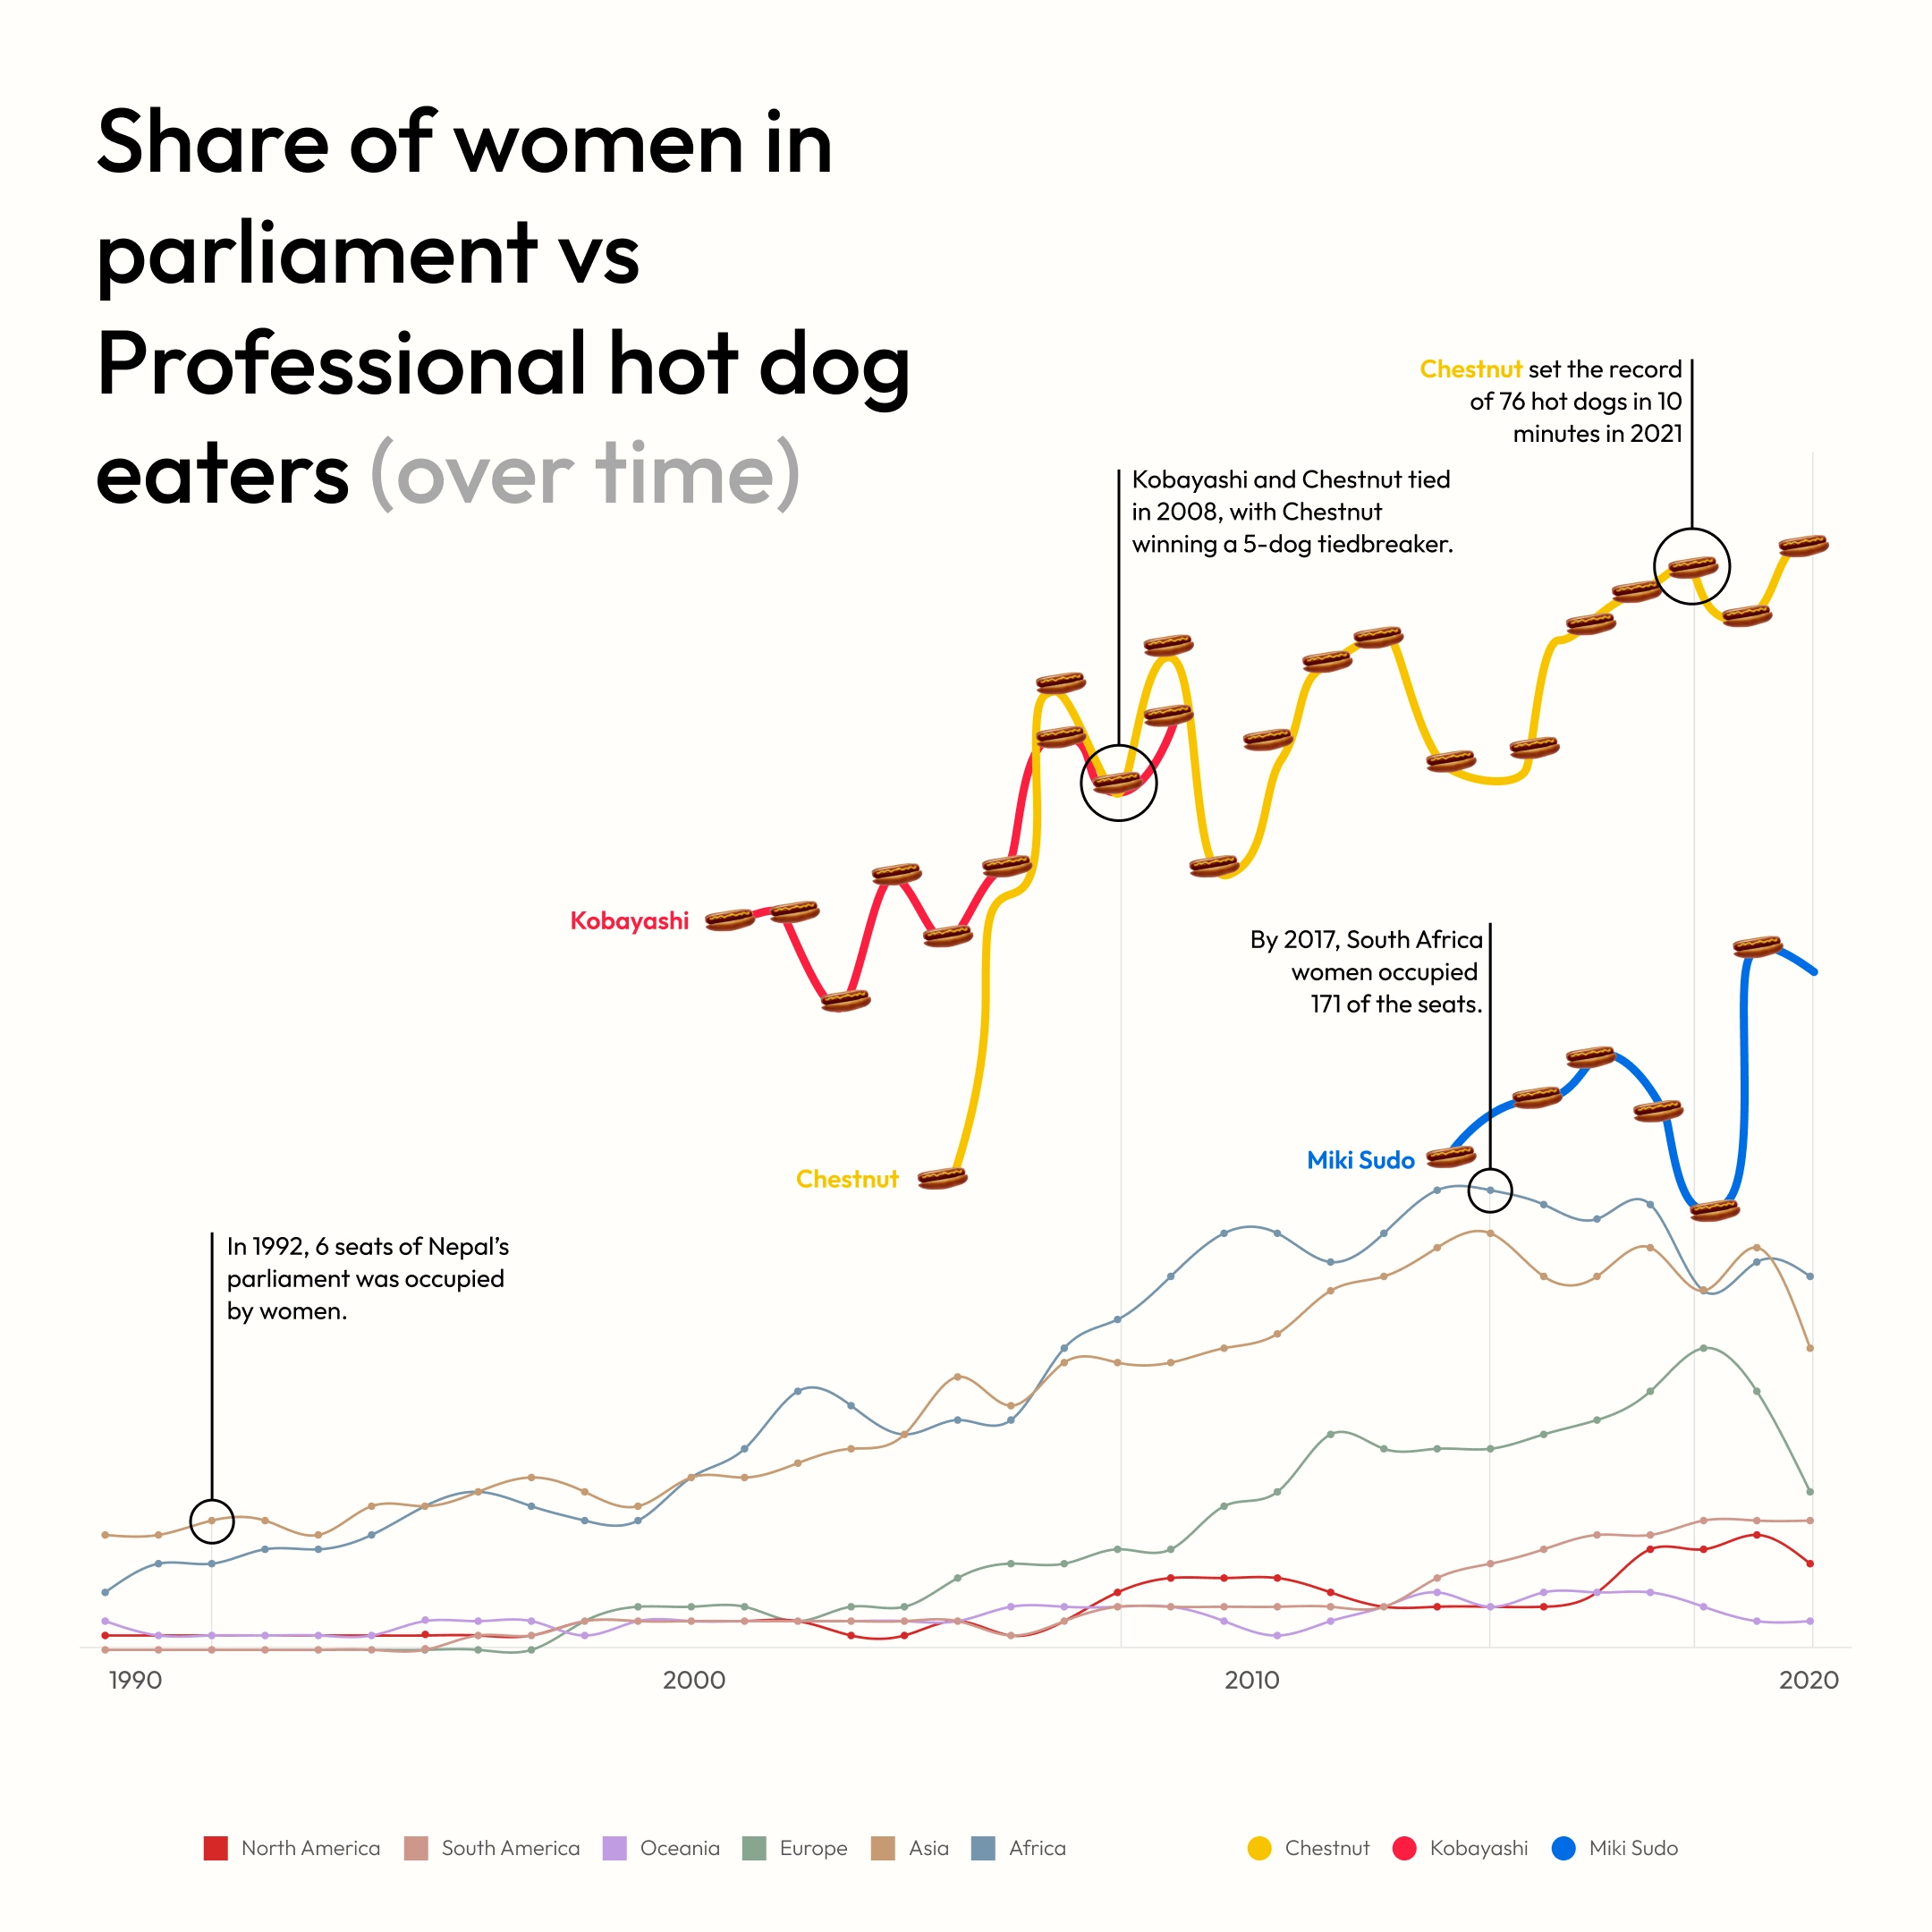
I found some data share of women in parliaments and How many hotdogs does a professional hot dog eater consumes. Not a fair correlation, but I don't care. There should be more women in parliamment anyways.
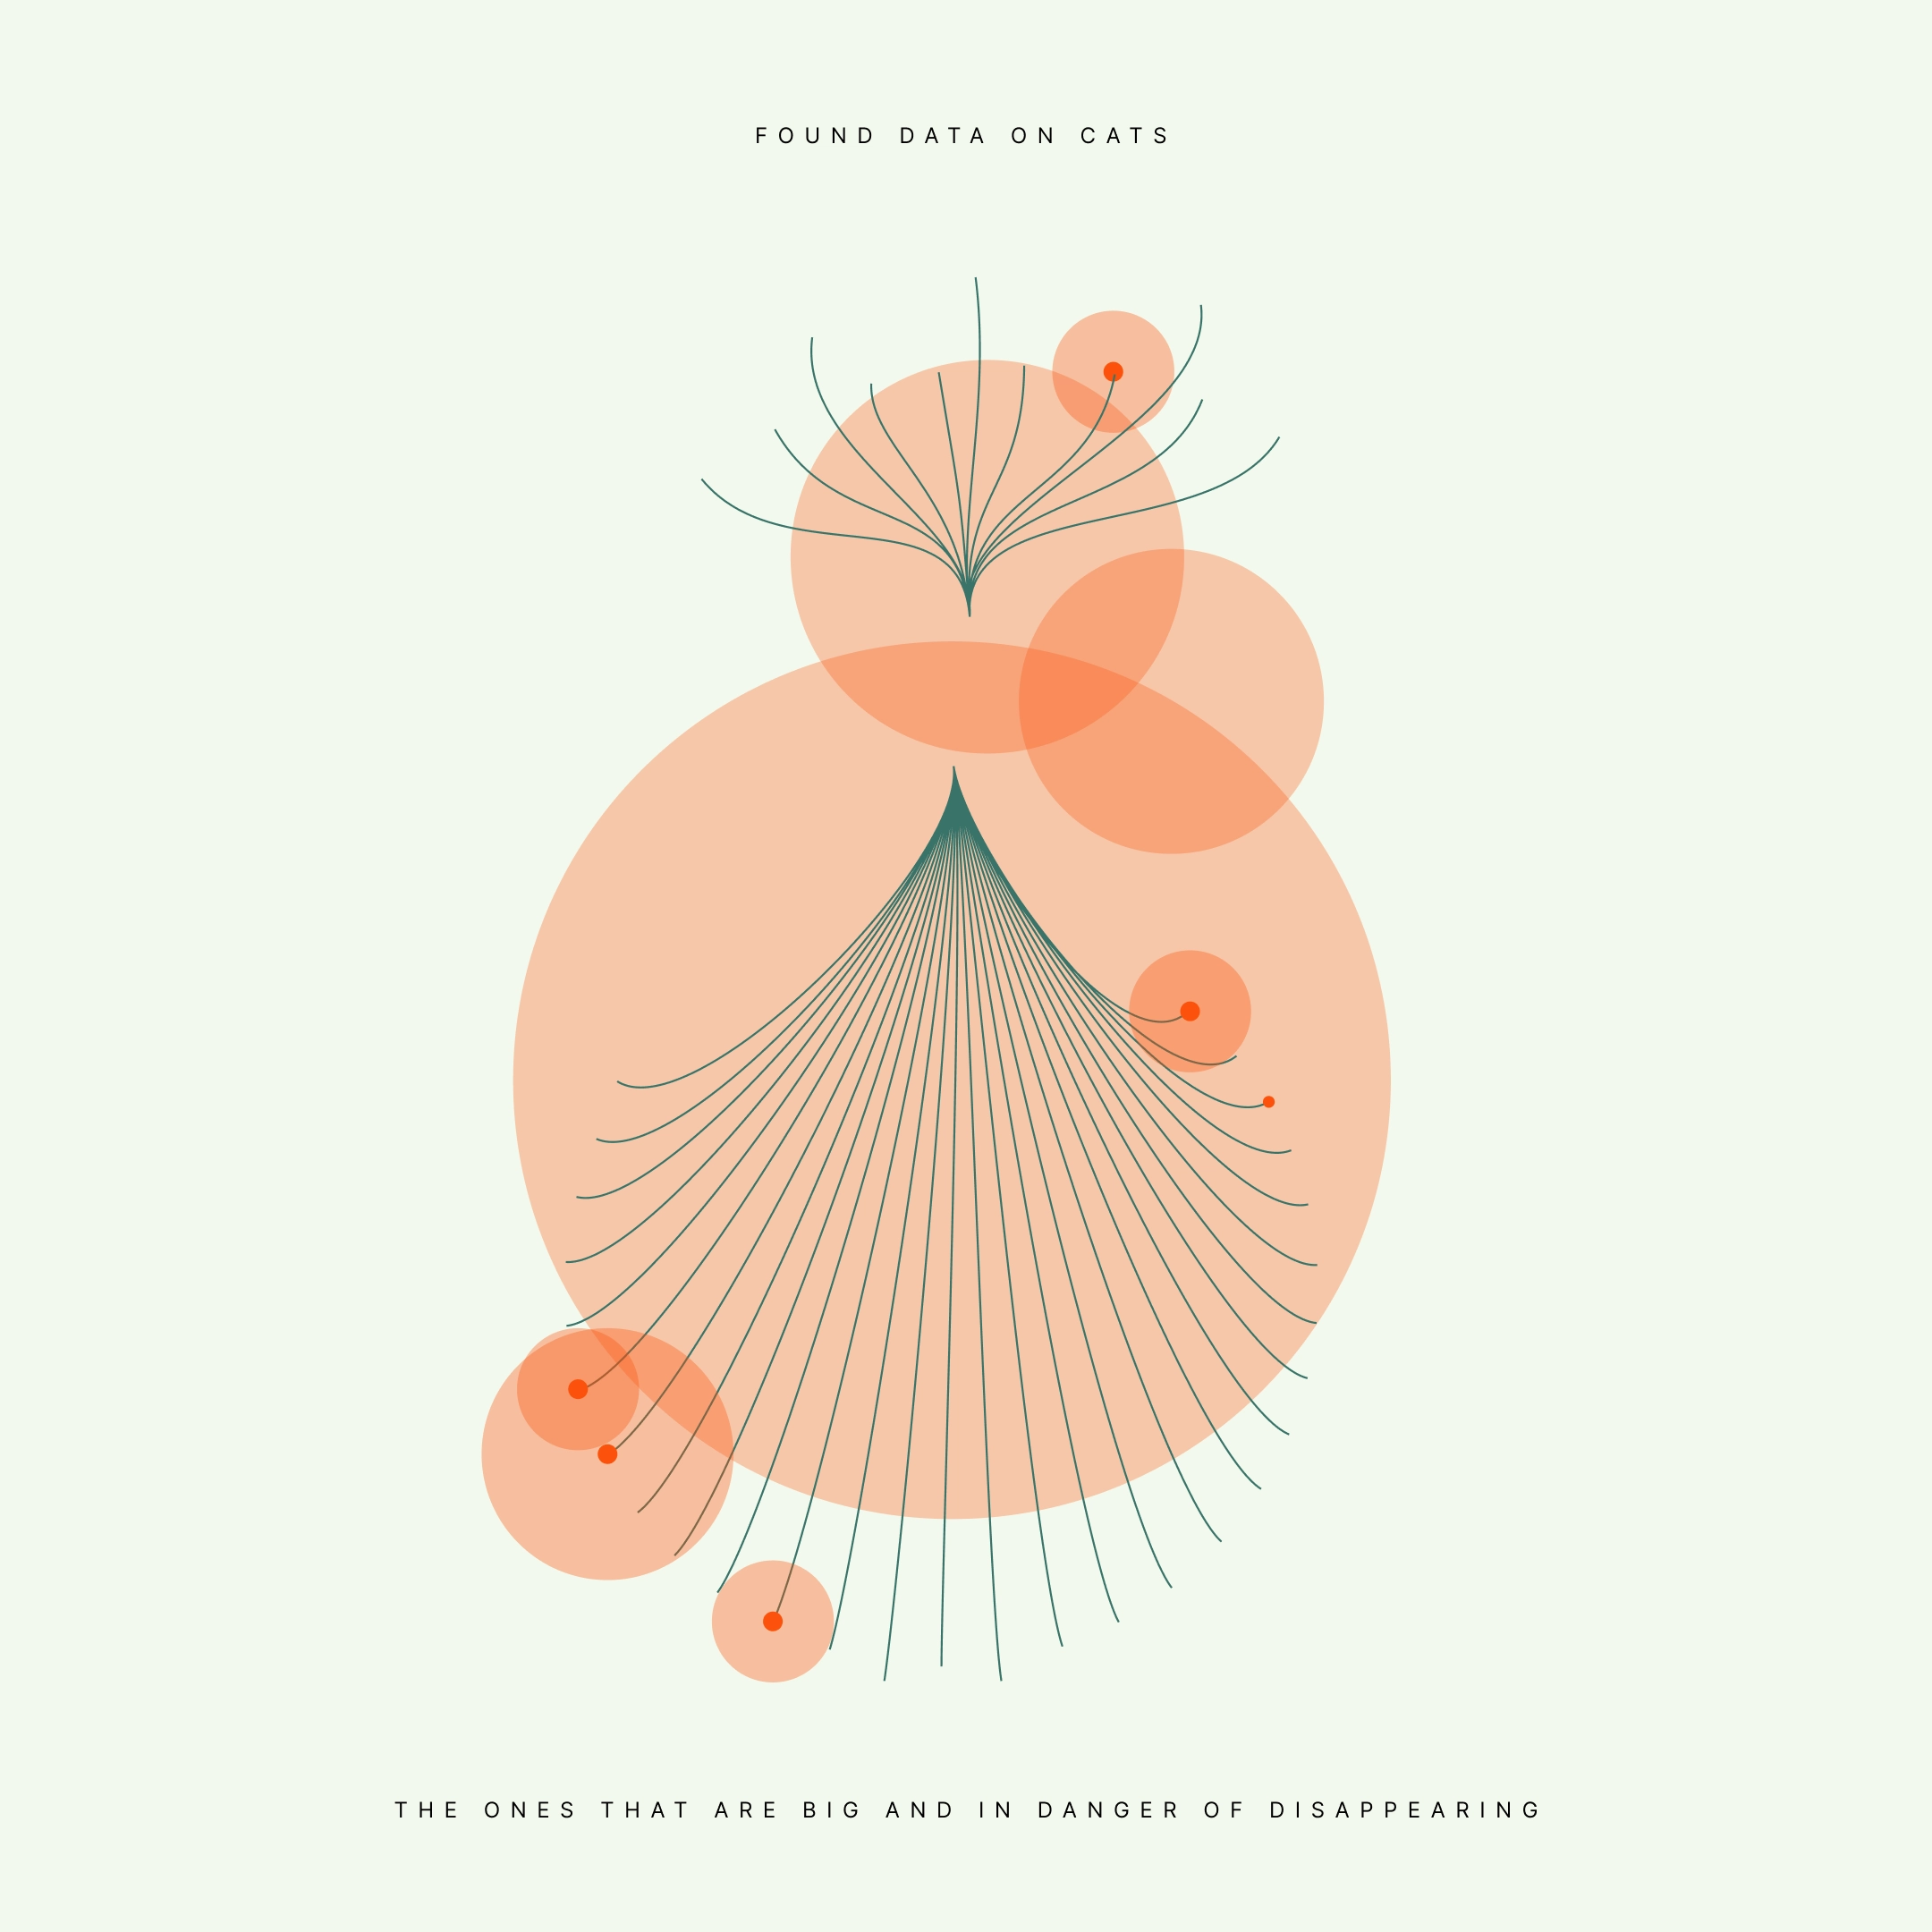
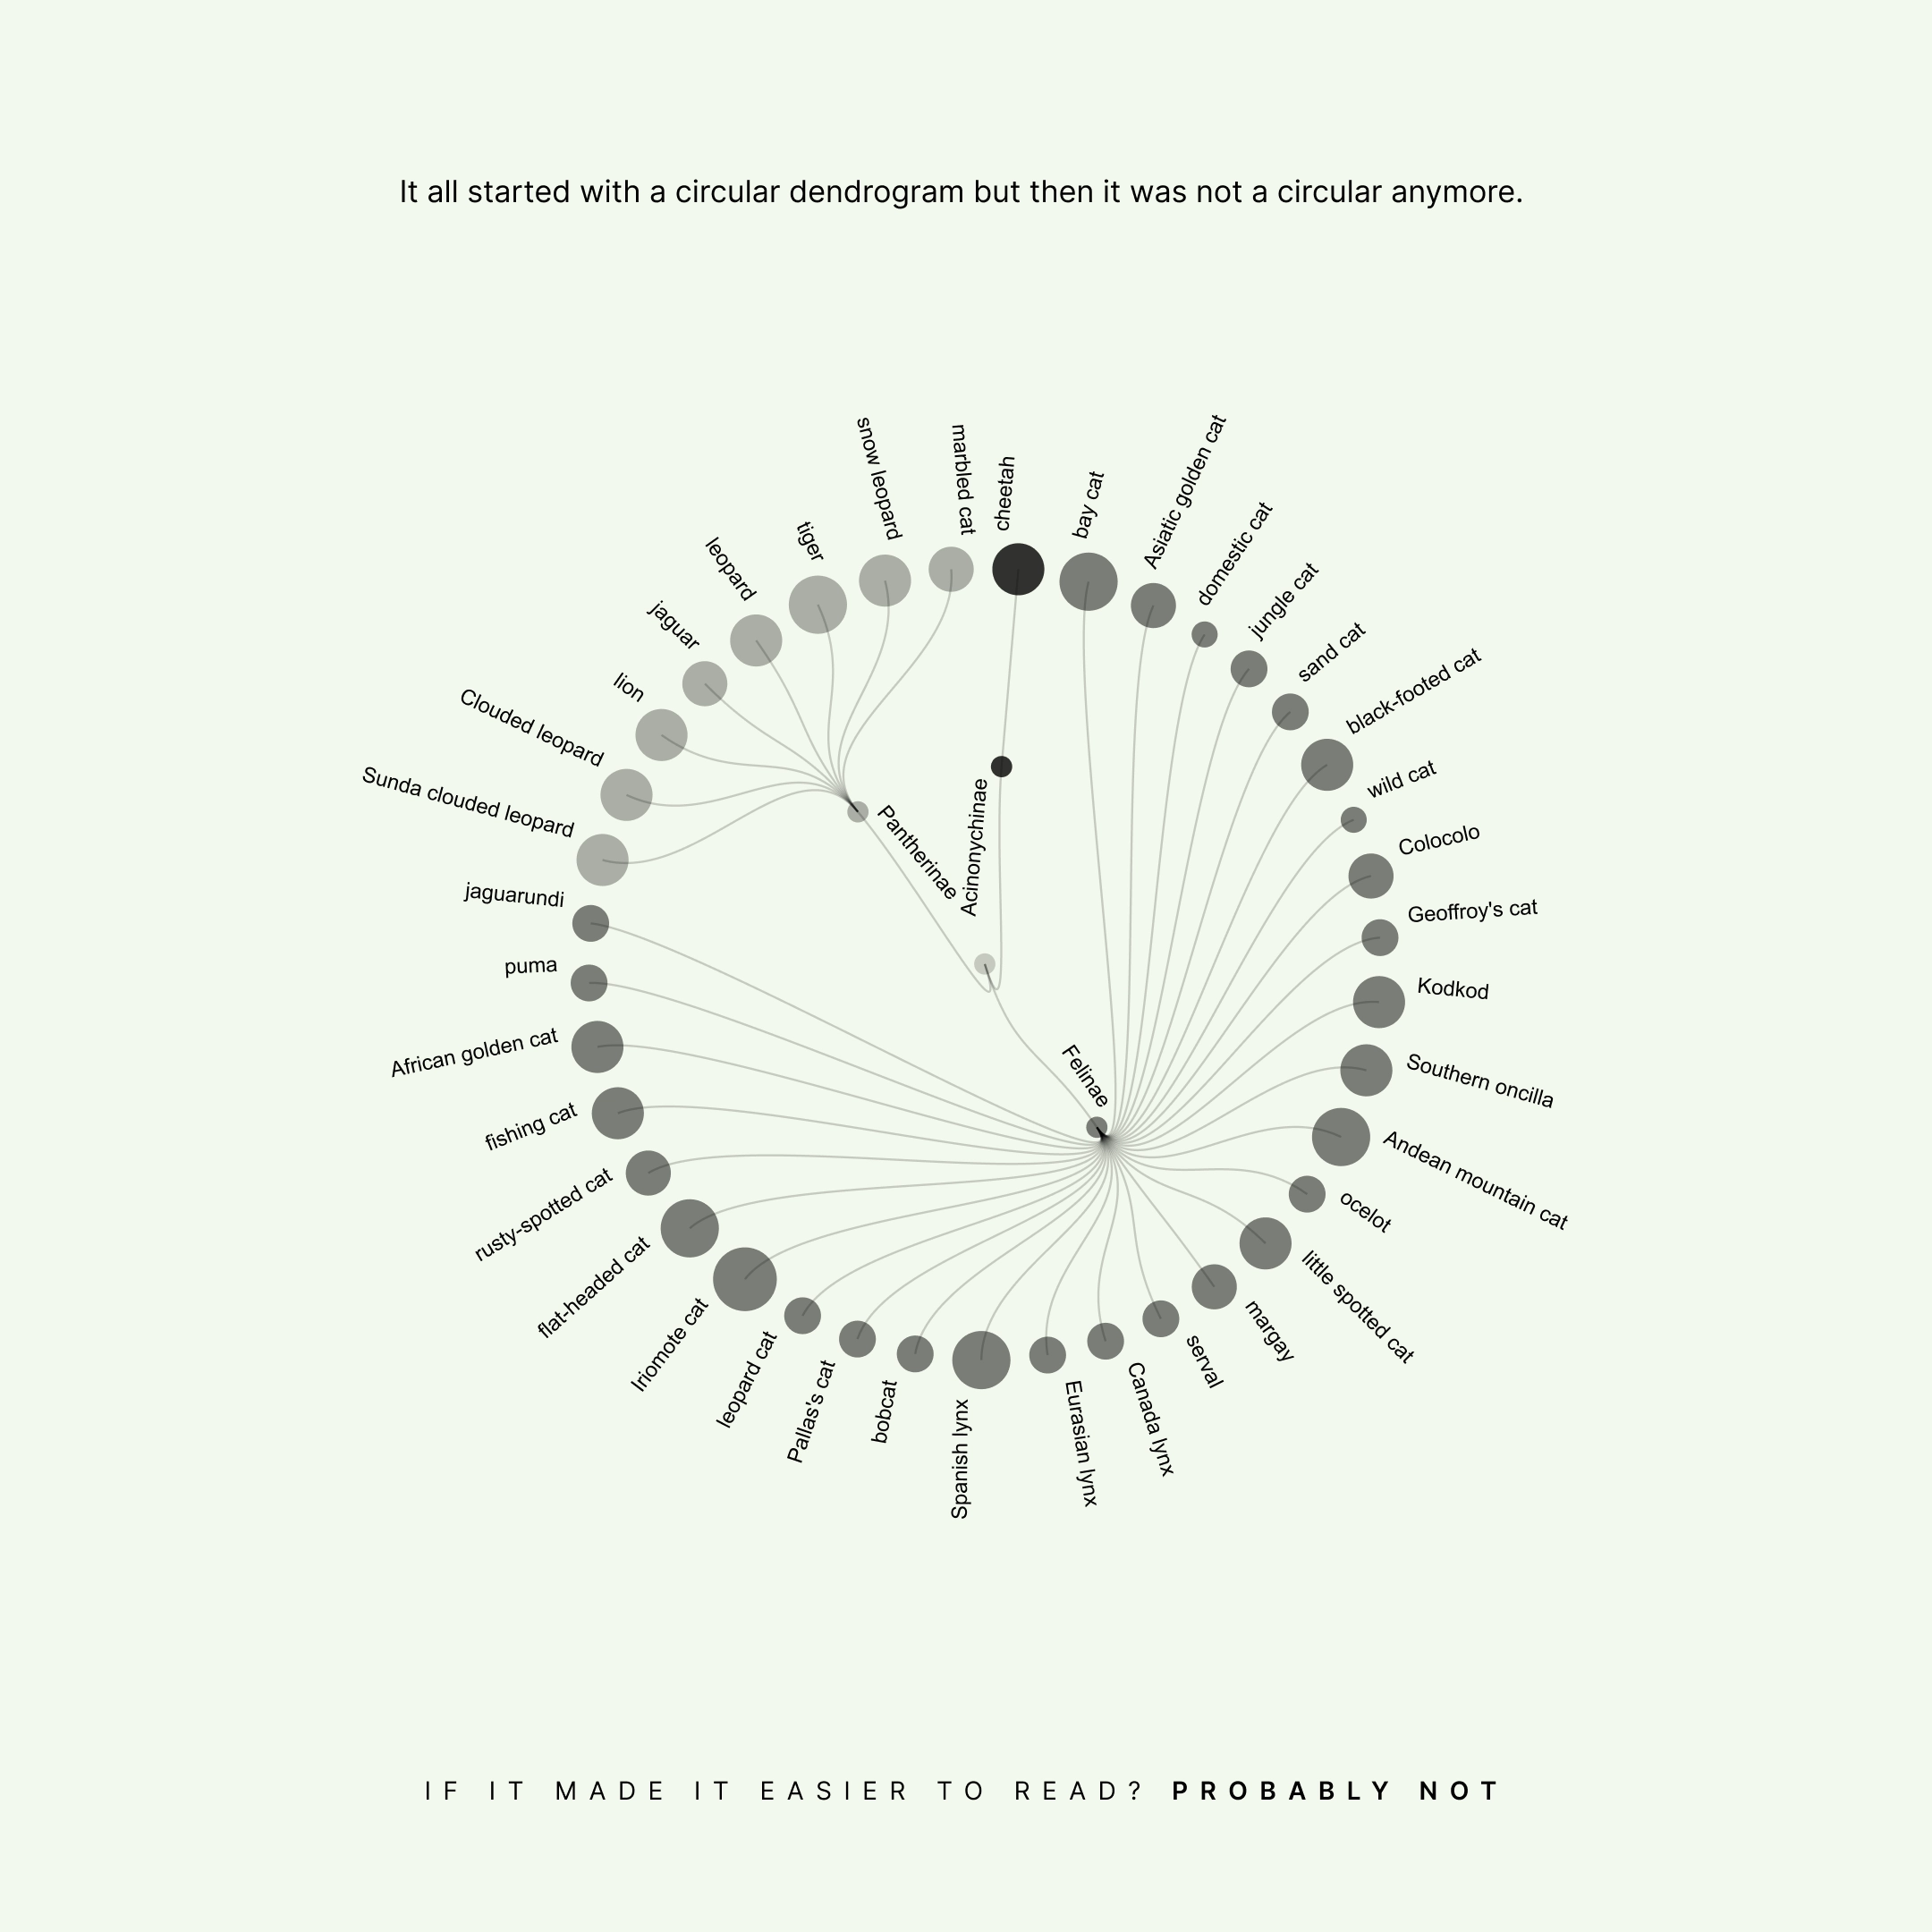
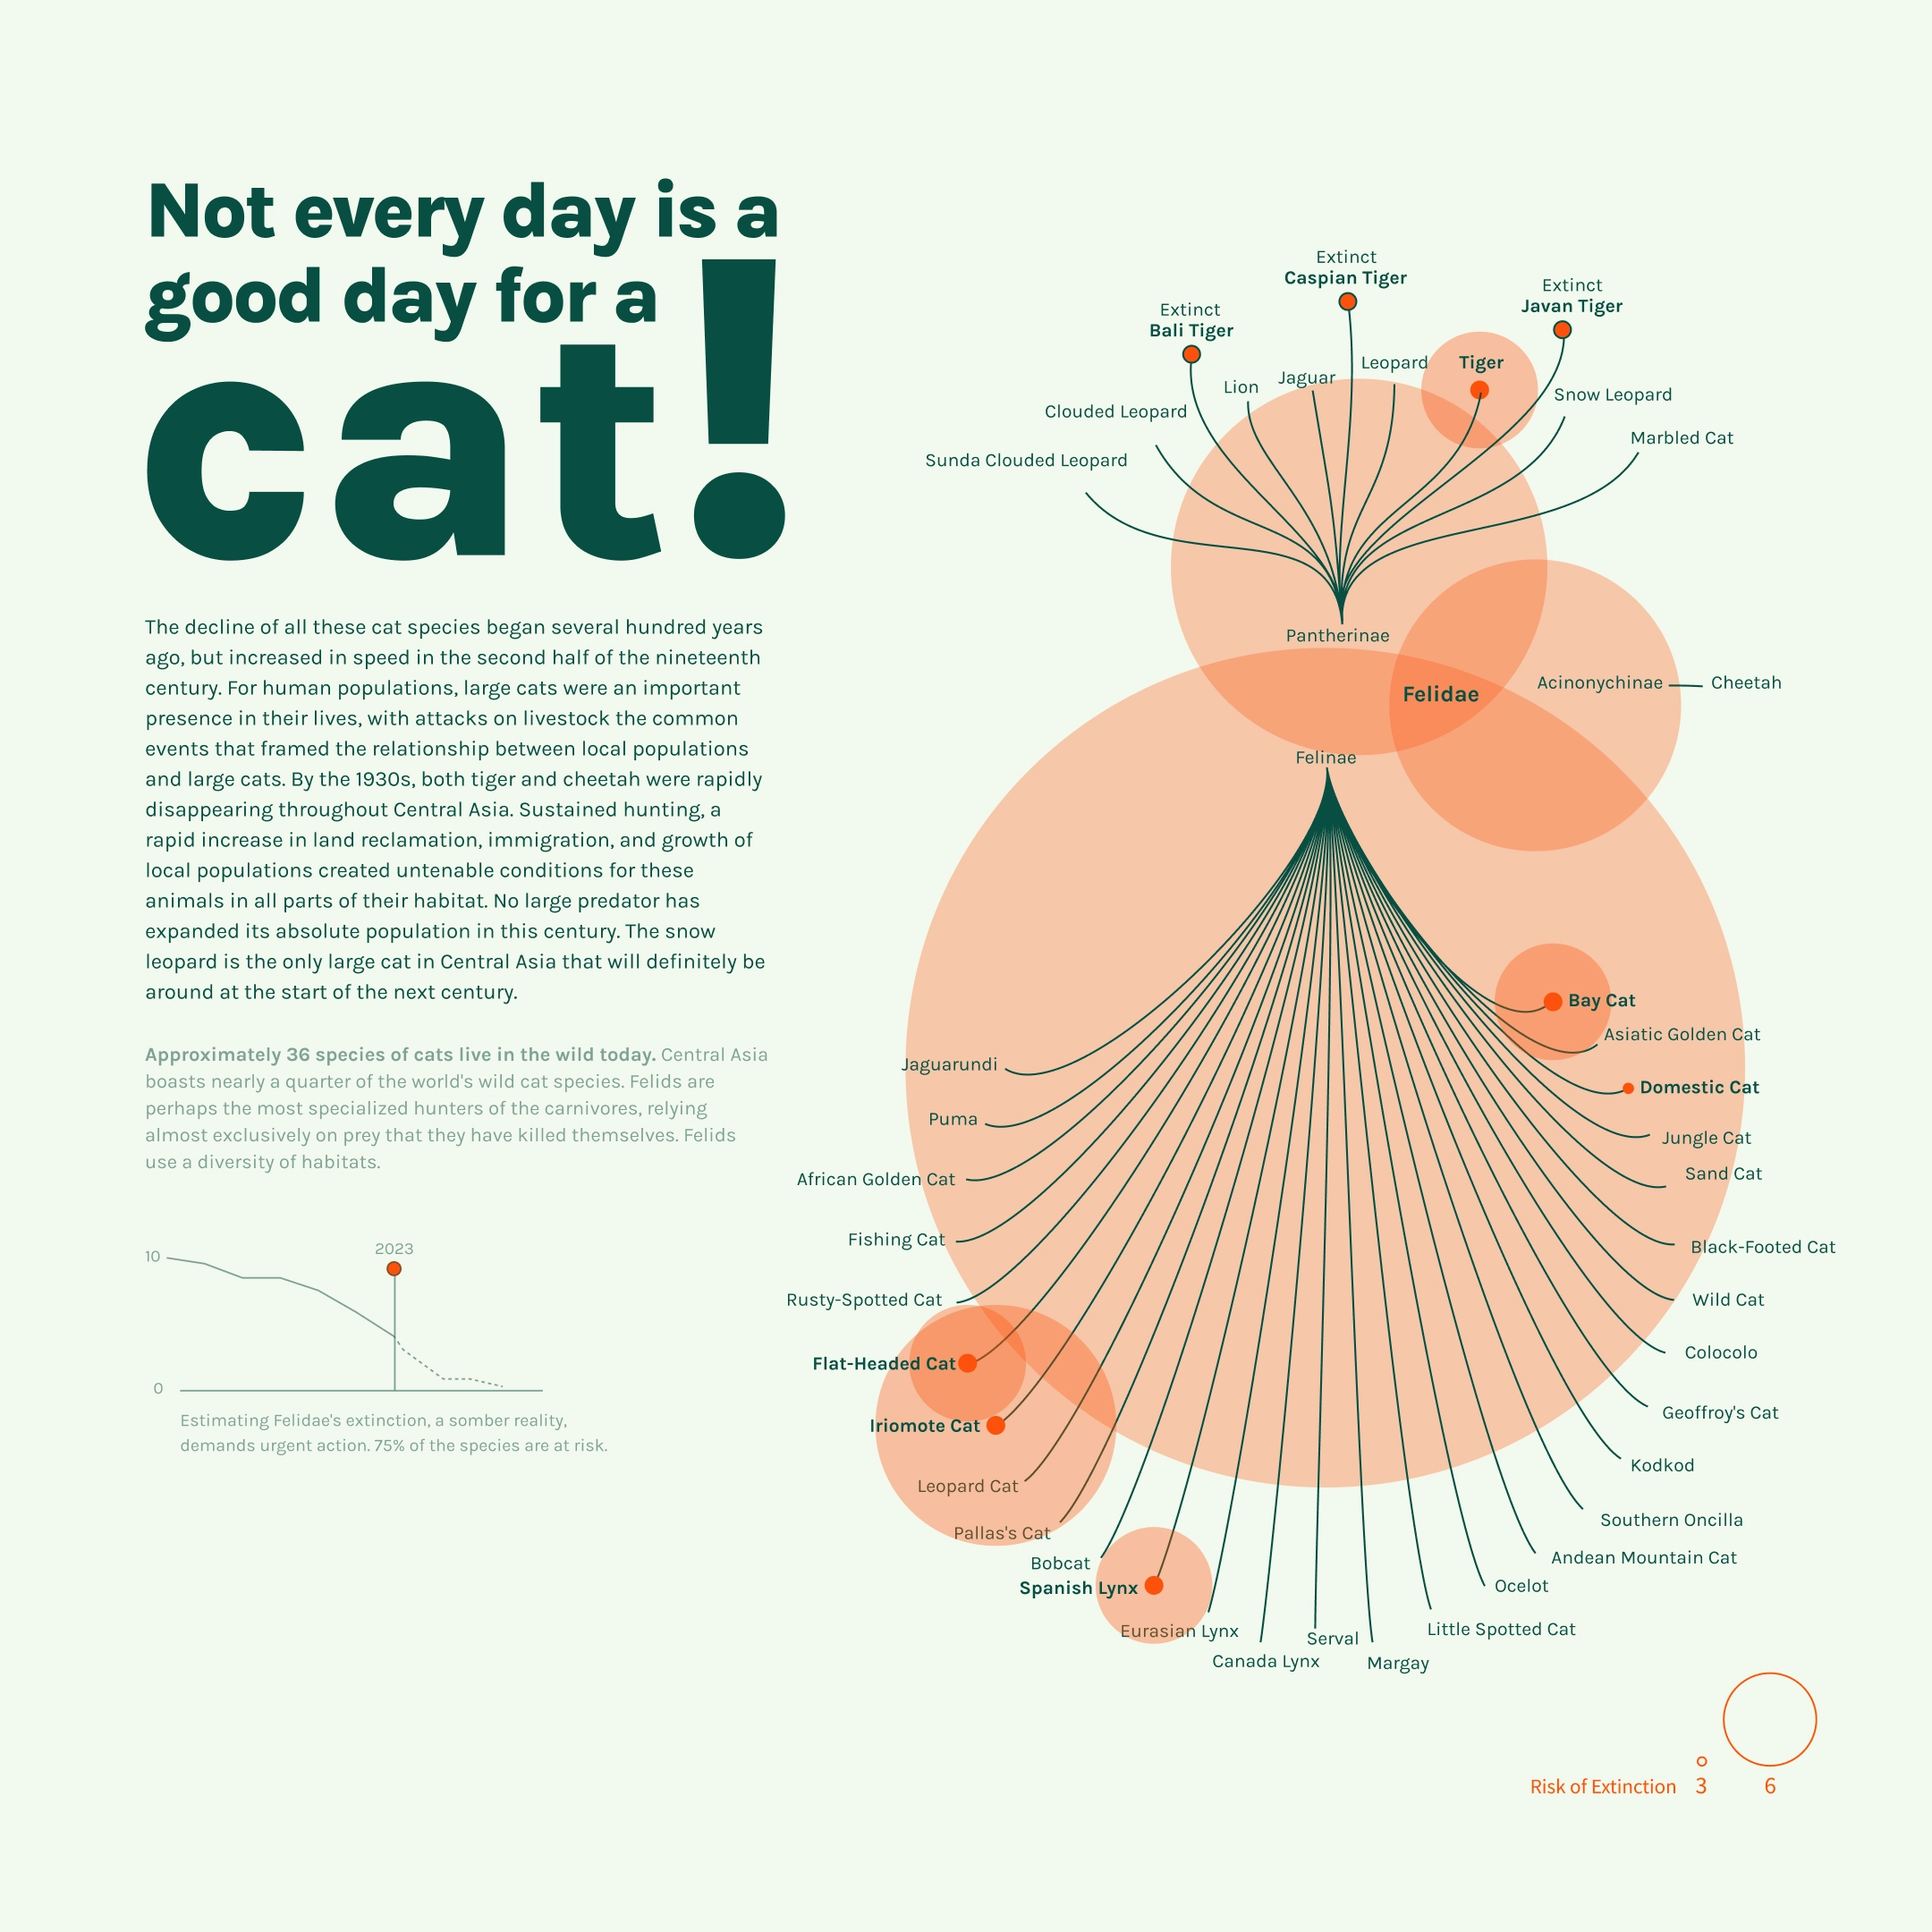
Found data on cats, but the ones that are big and in danger of disappearing.
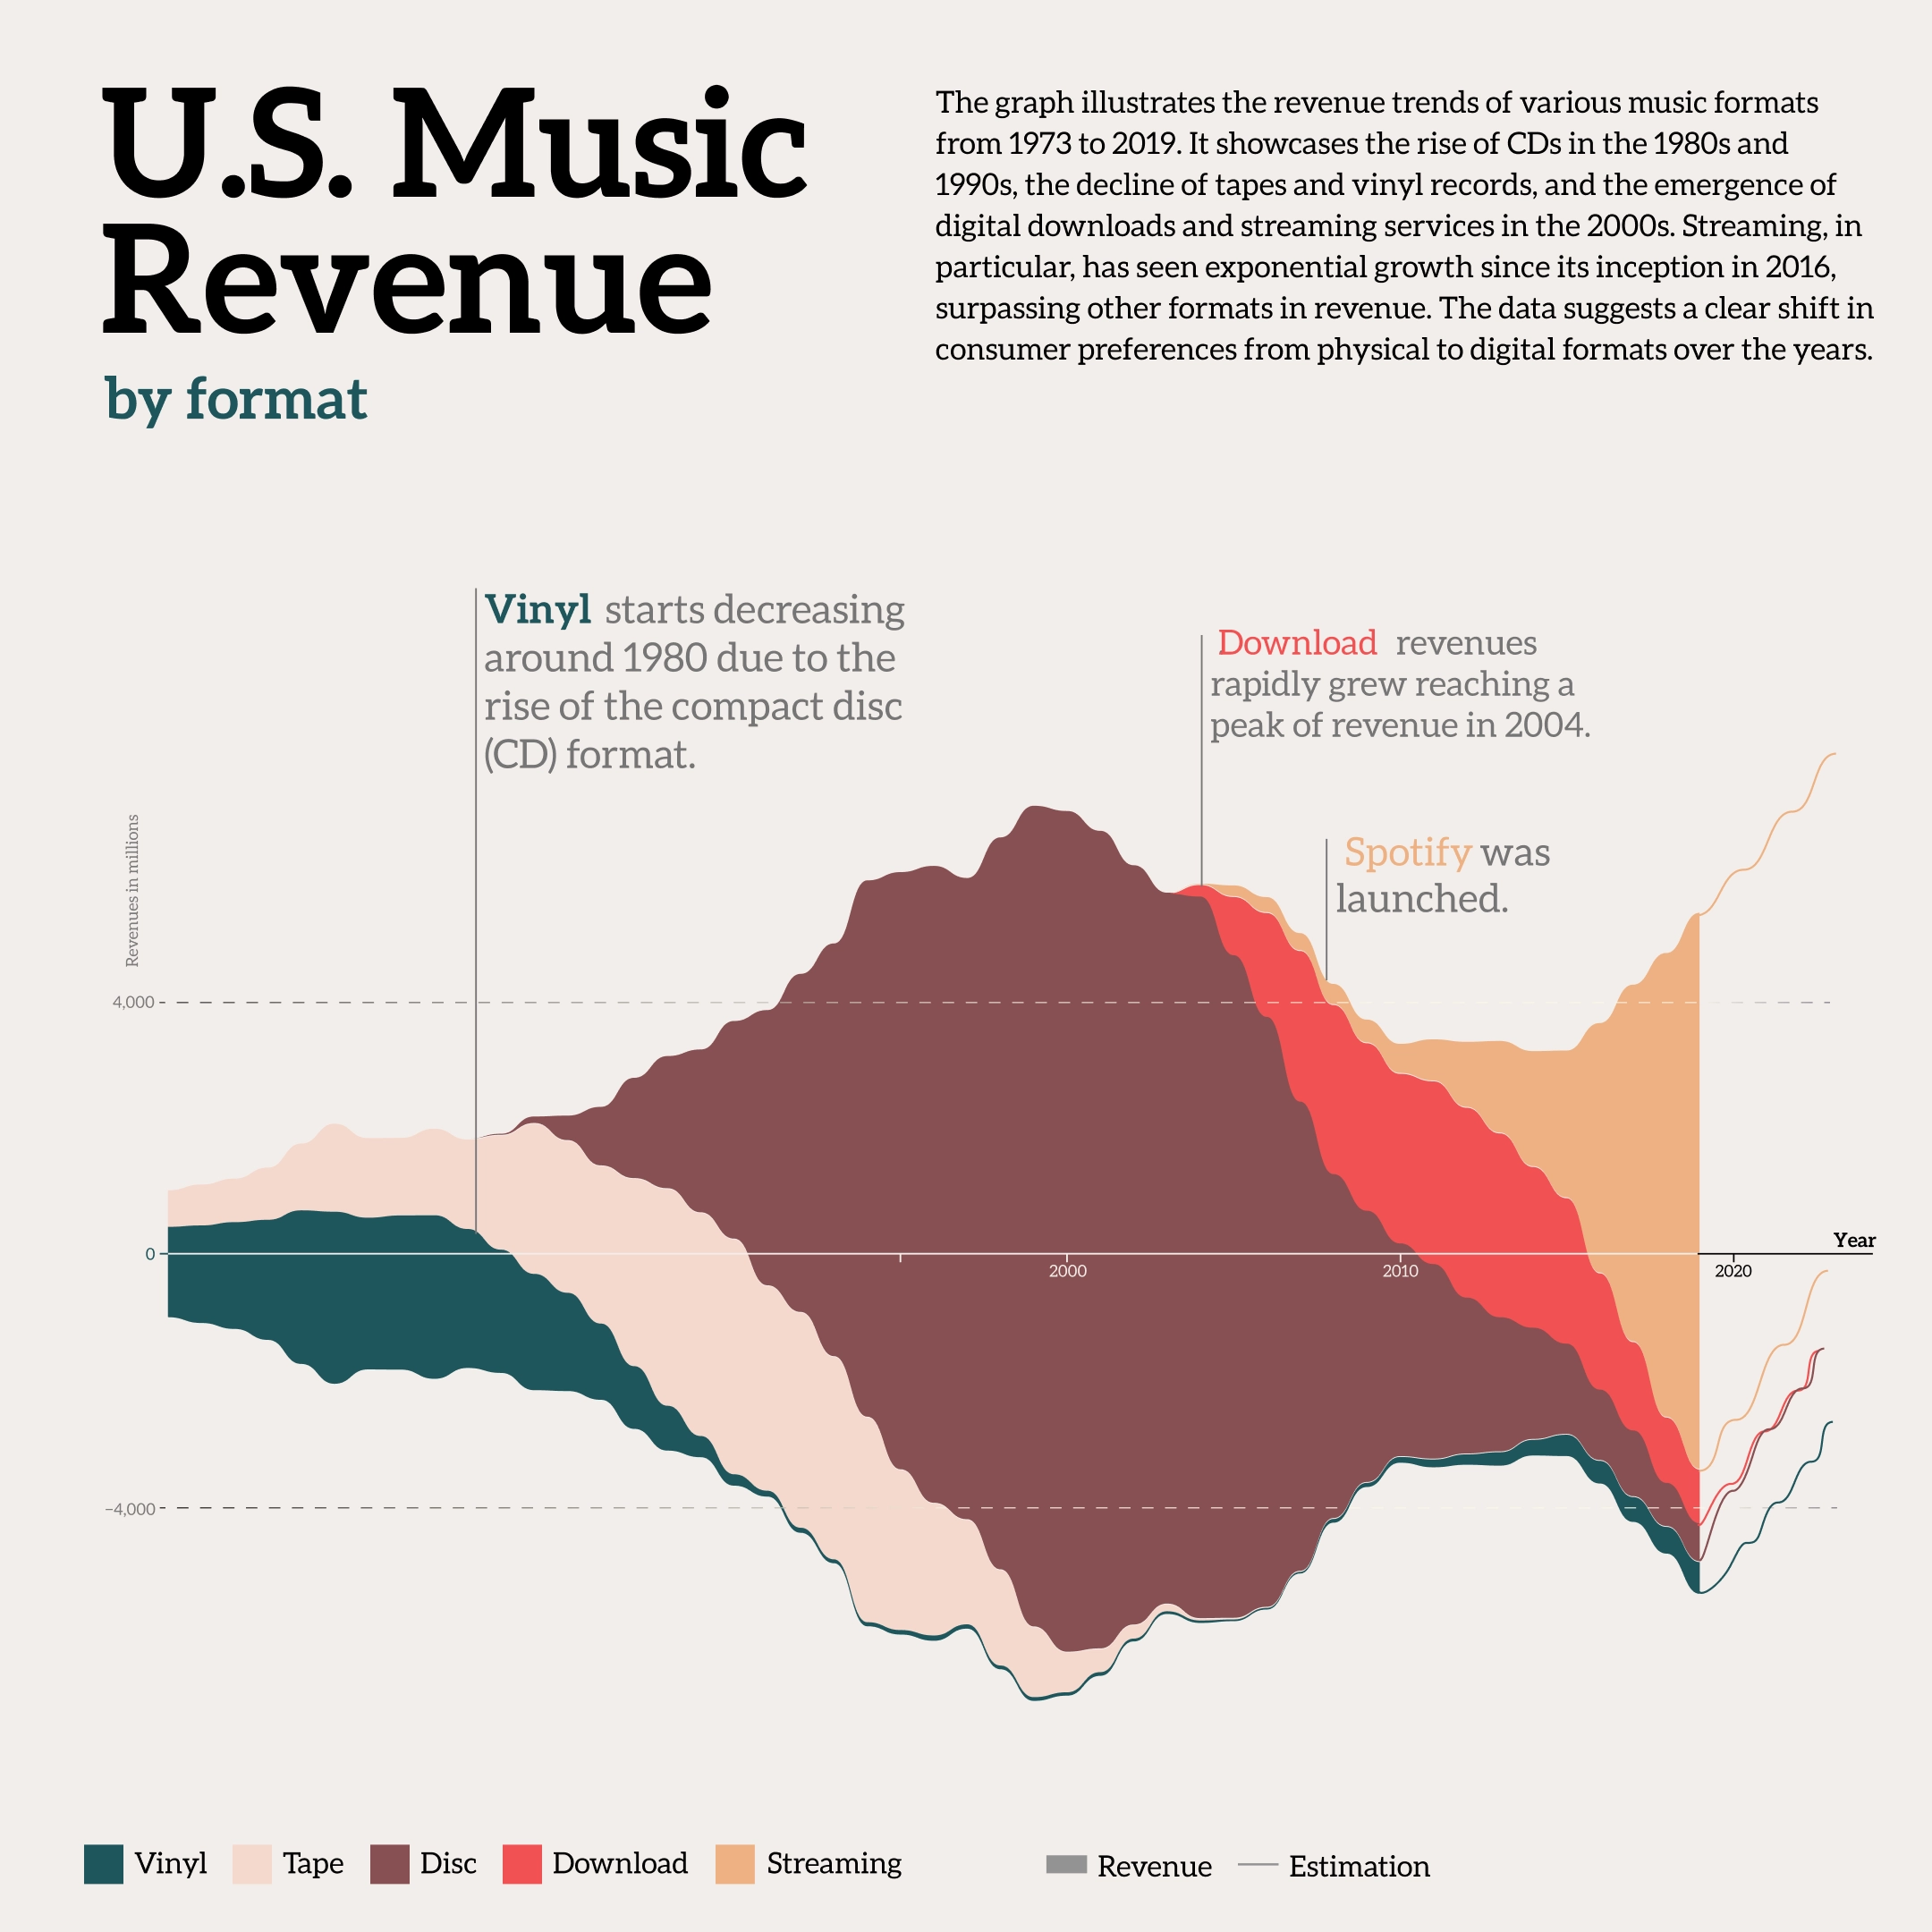
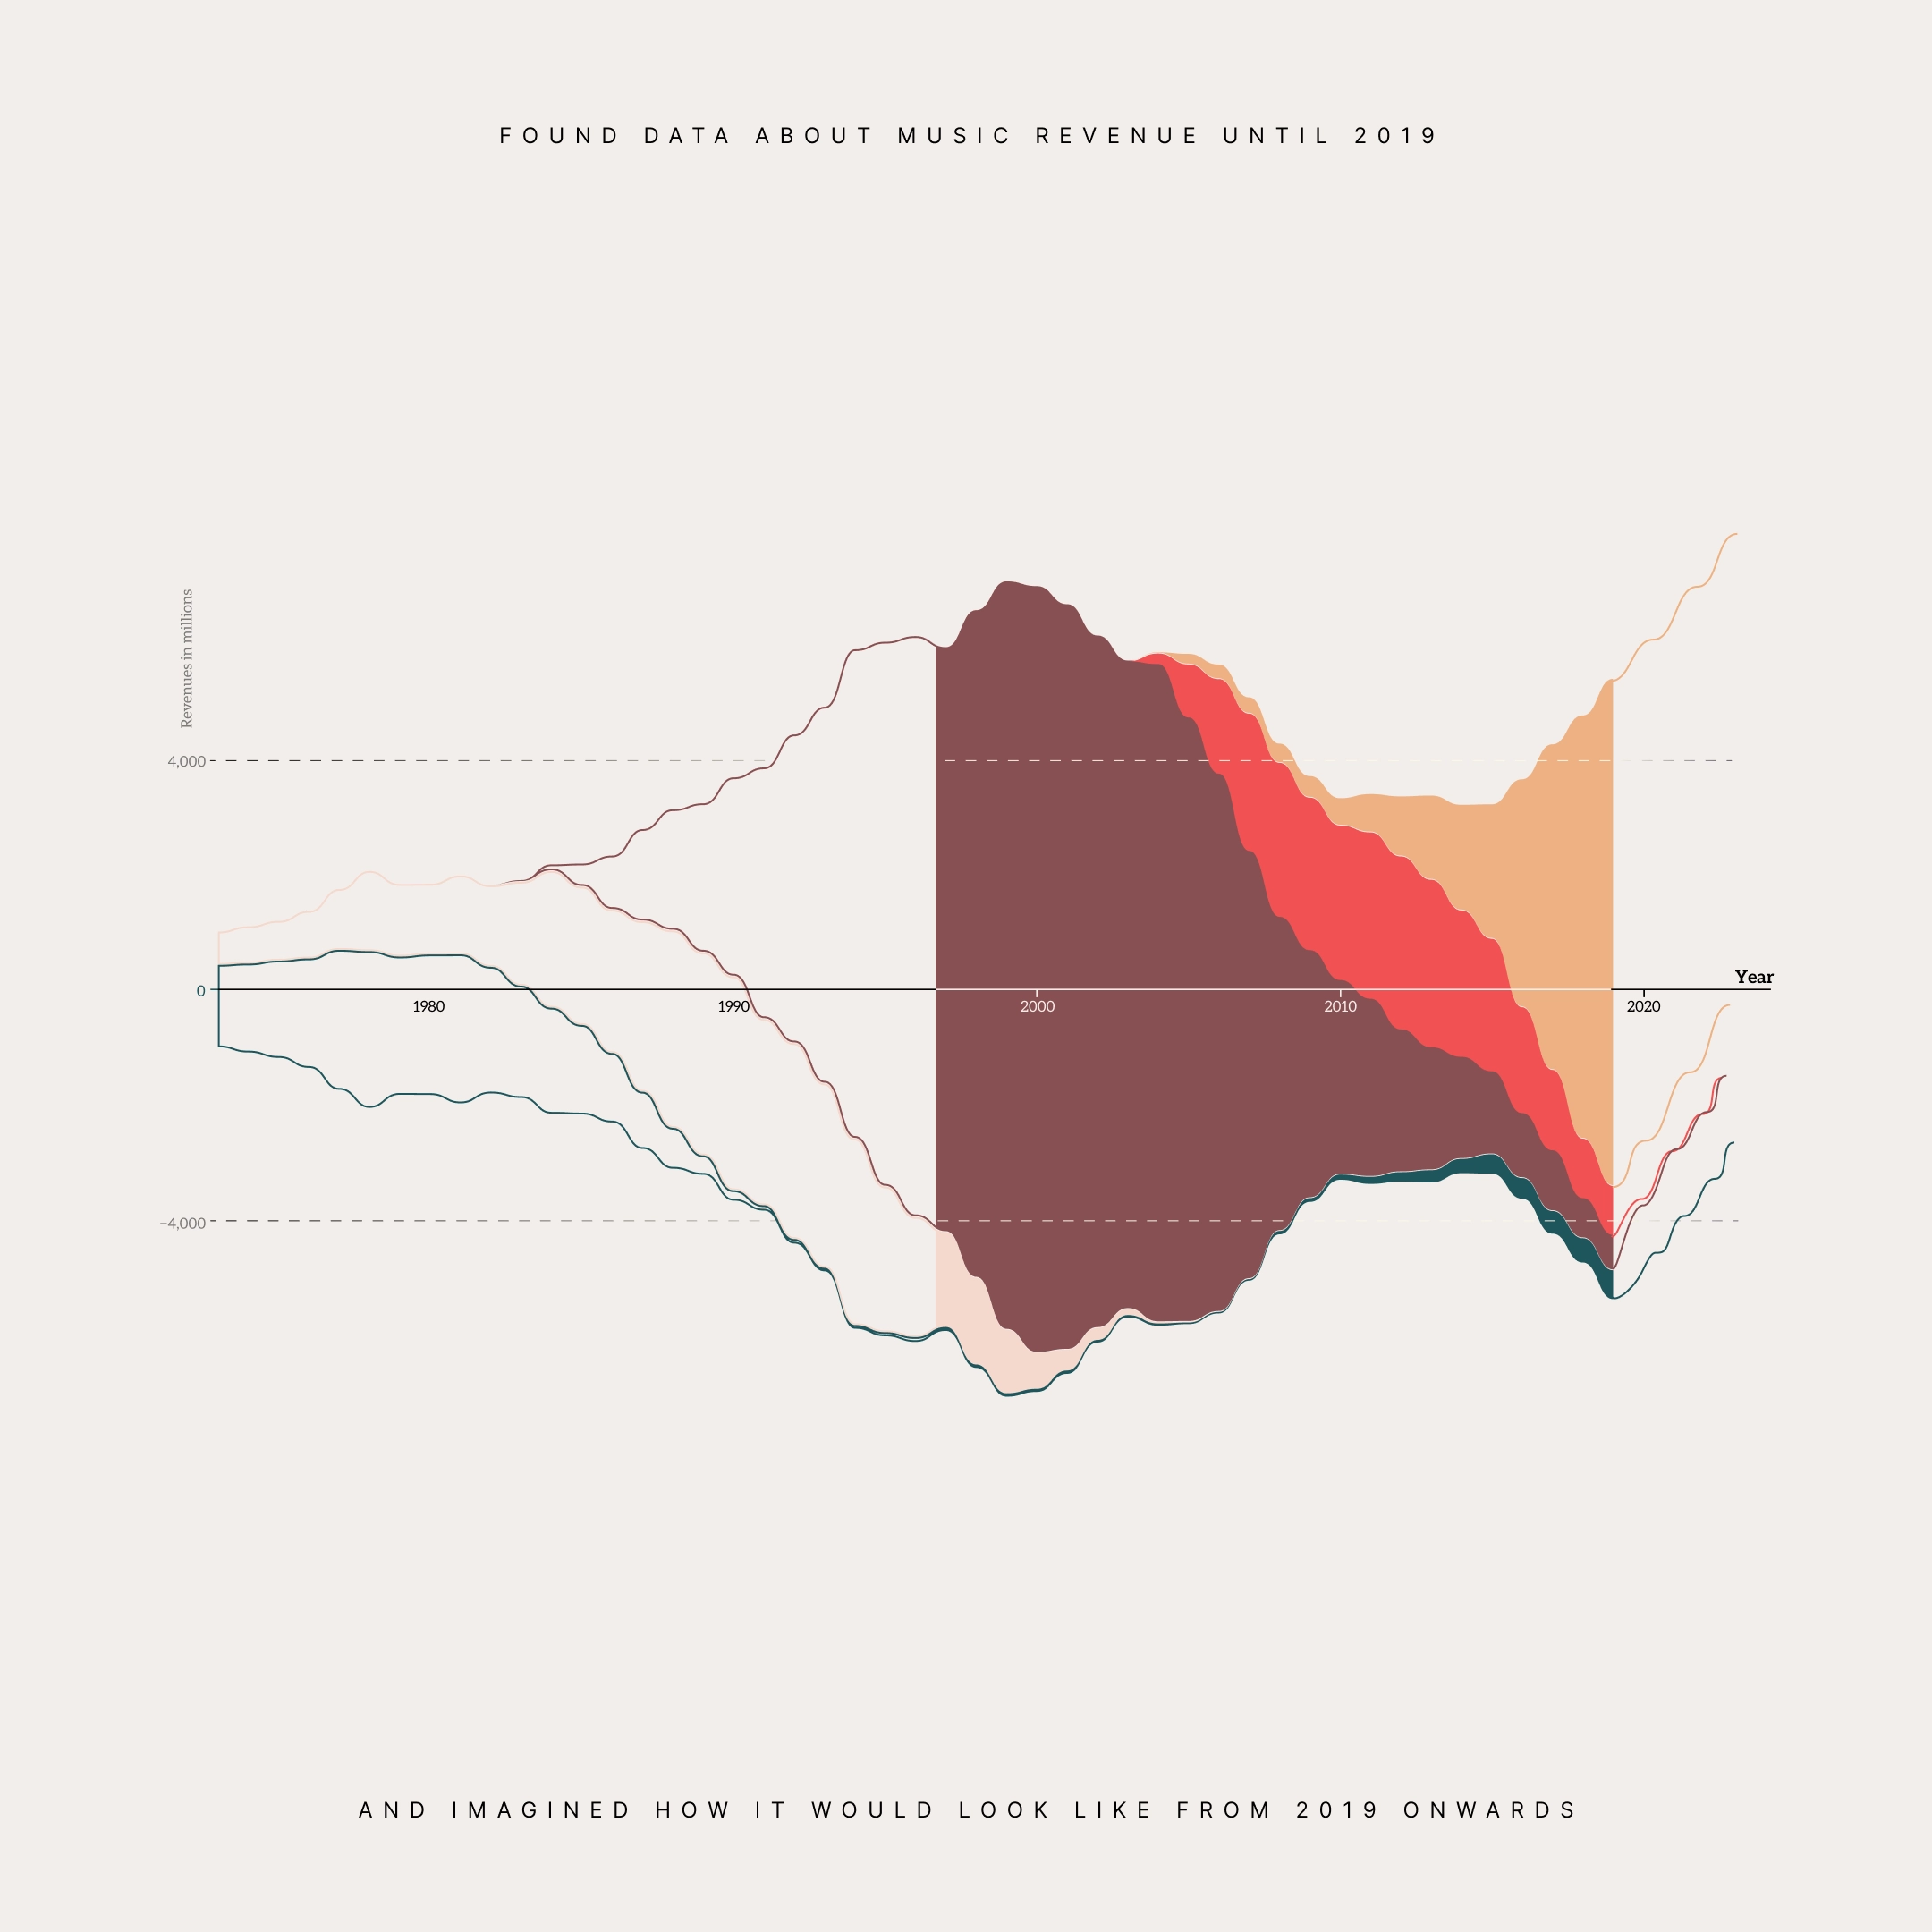
Found Data about music revenue until 2019 and imagined how it would look like from 2019 onwards.
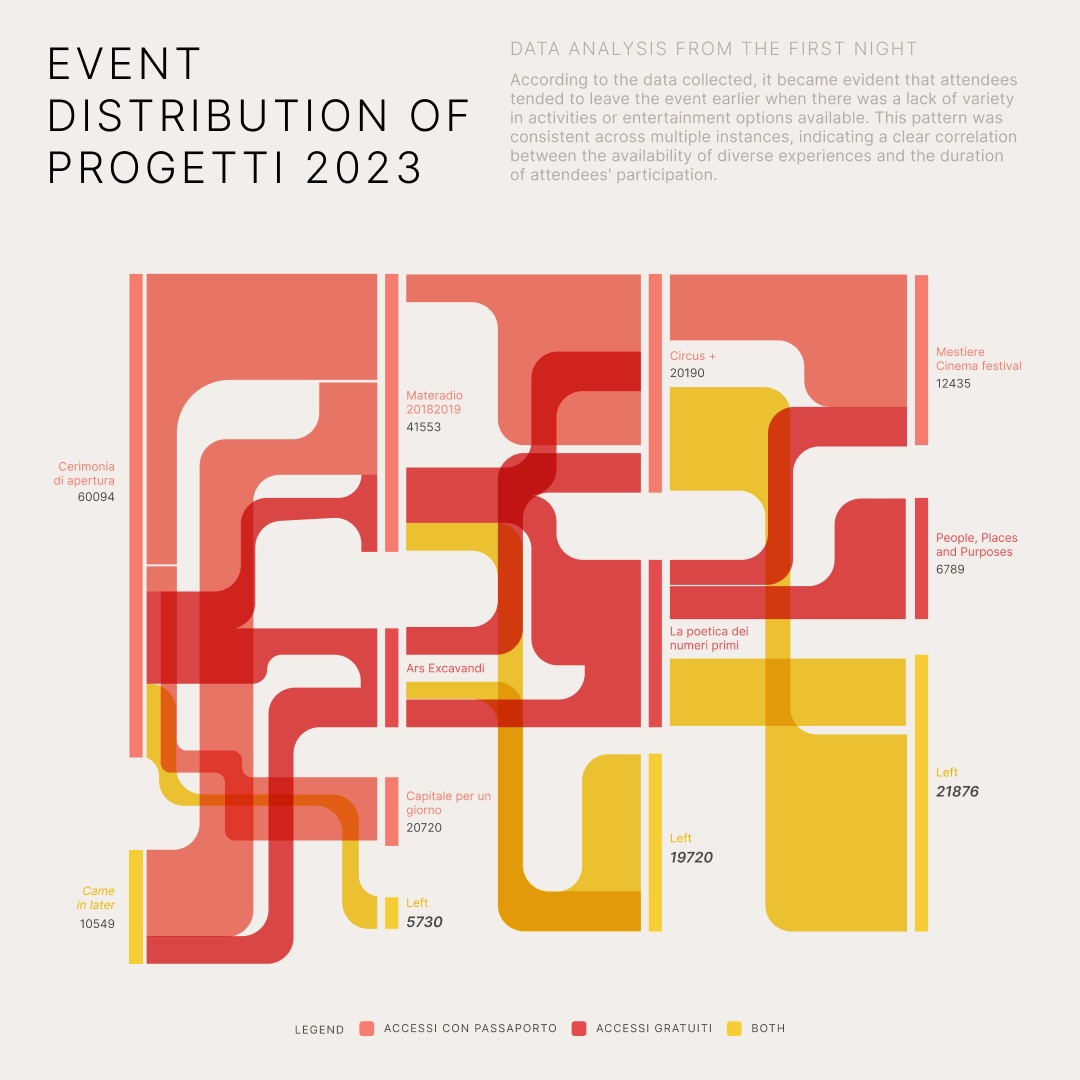
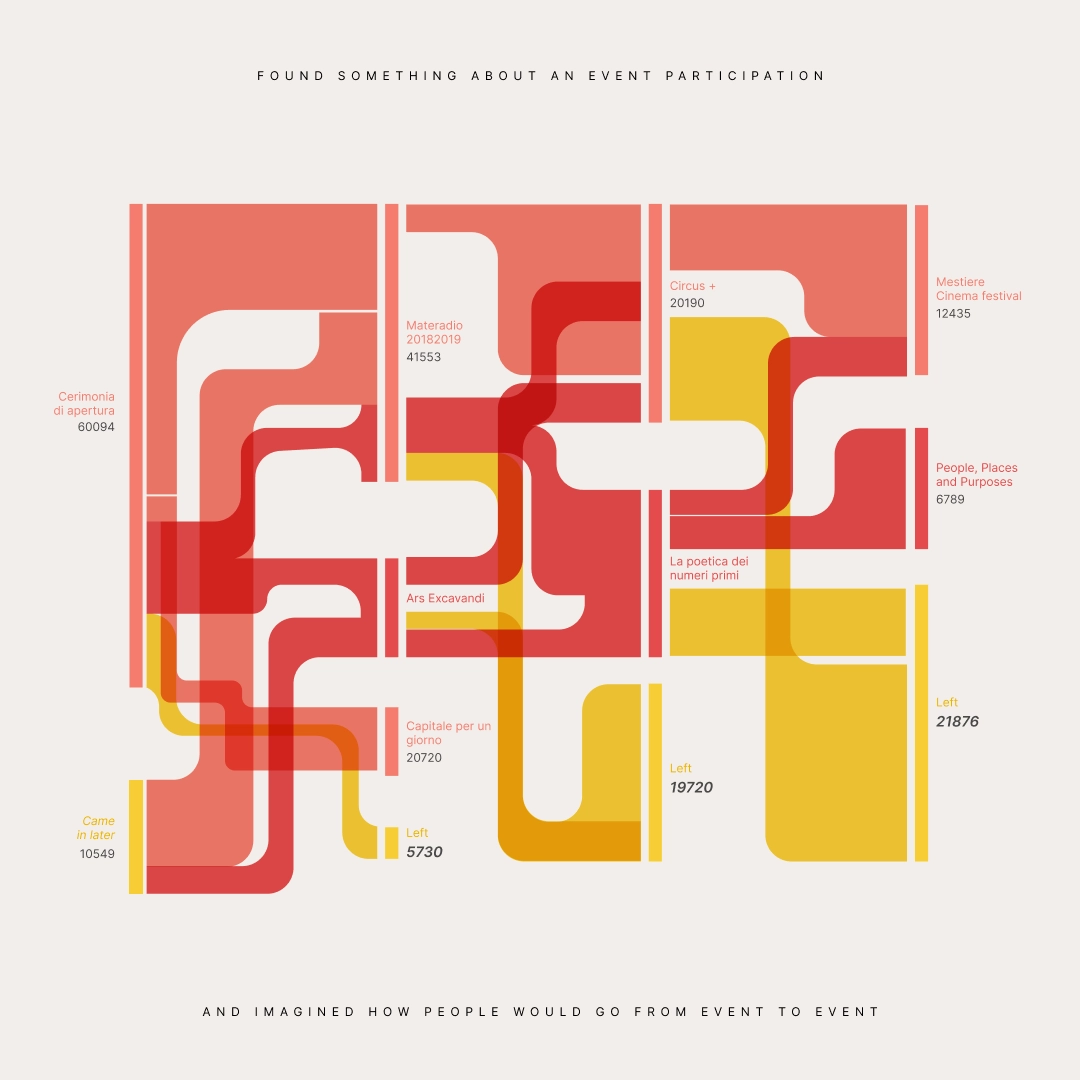
Found something about an event participation And imagined how people would go from event to event. Not my favourite but hey that's doodling I guess.
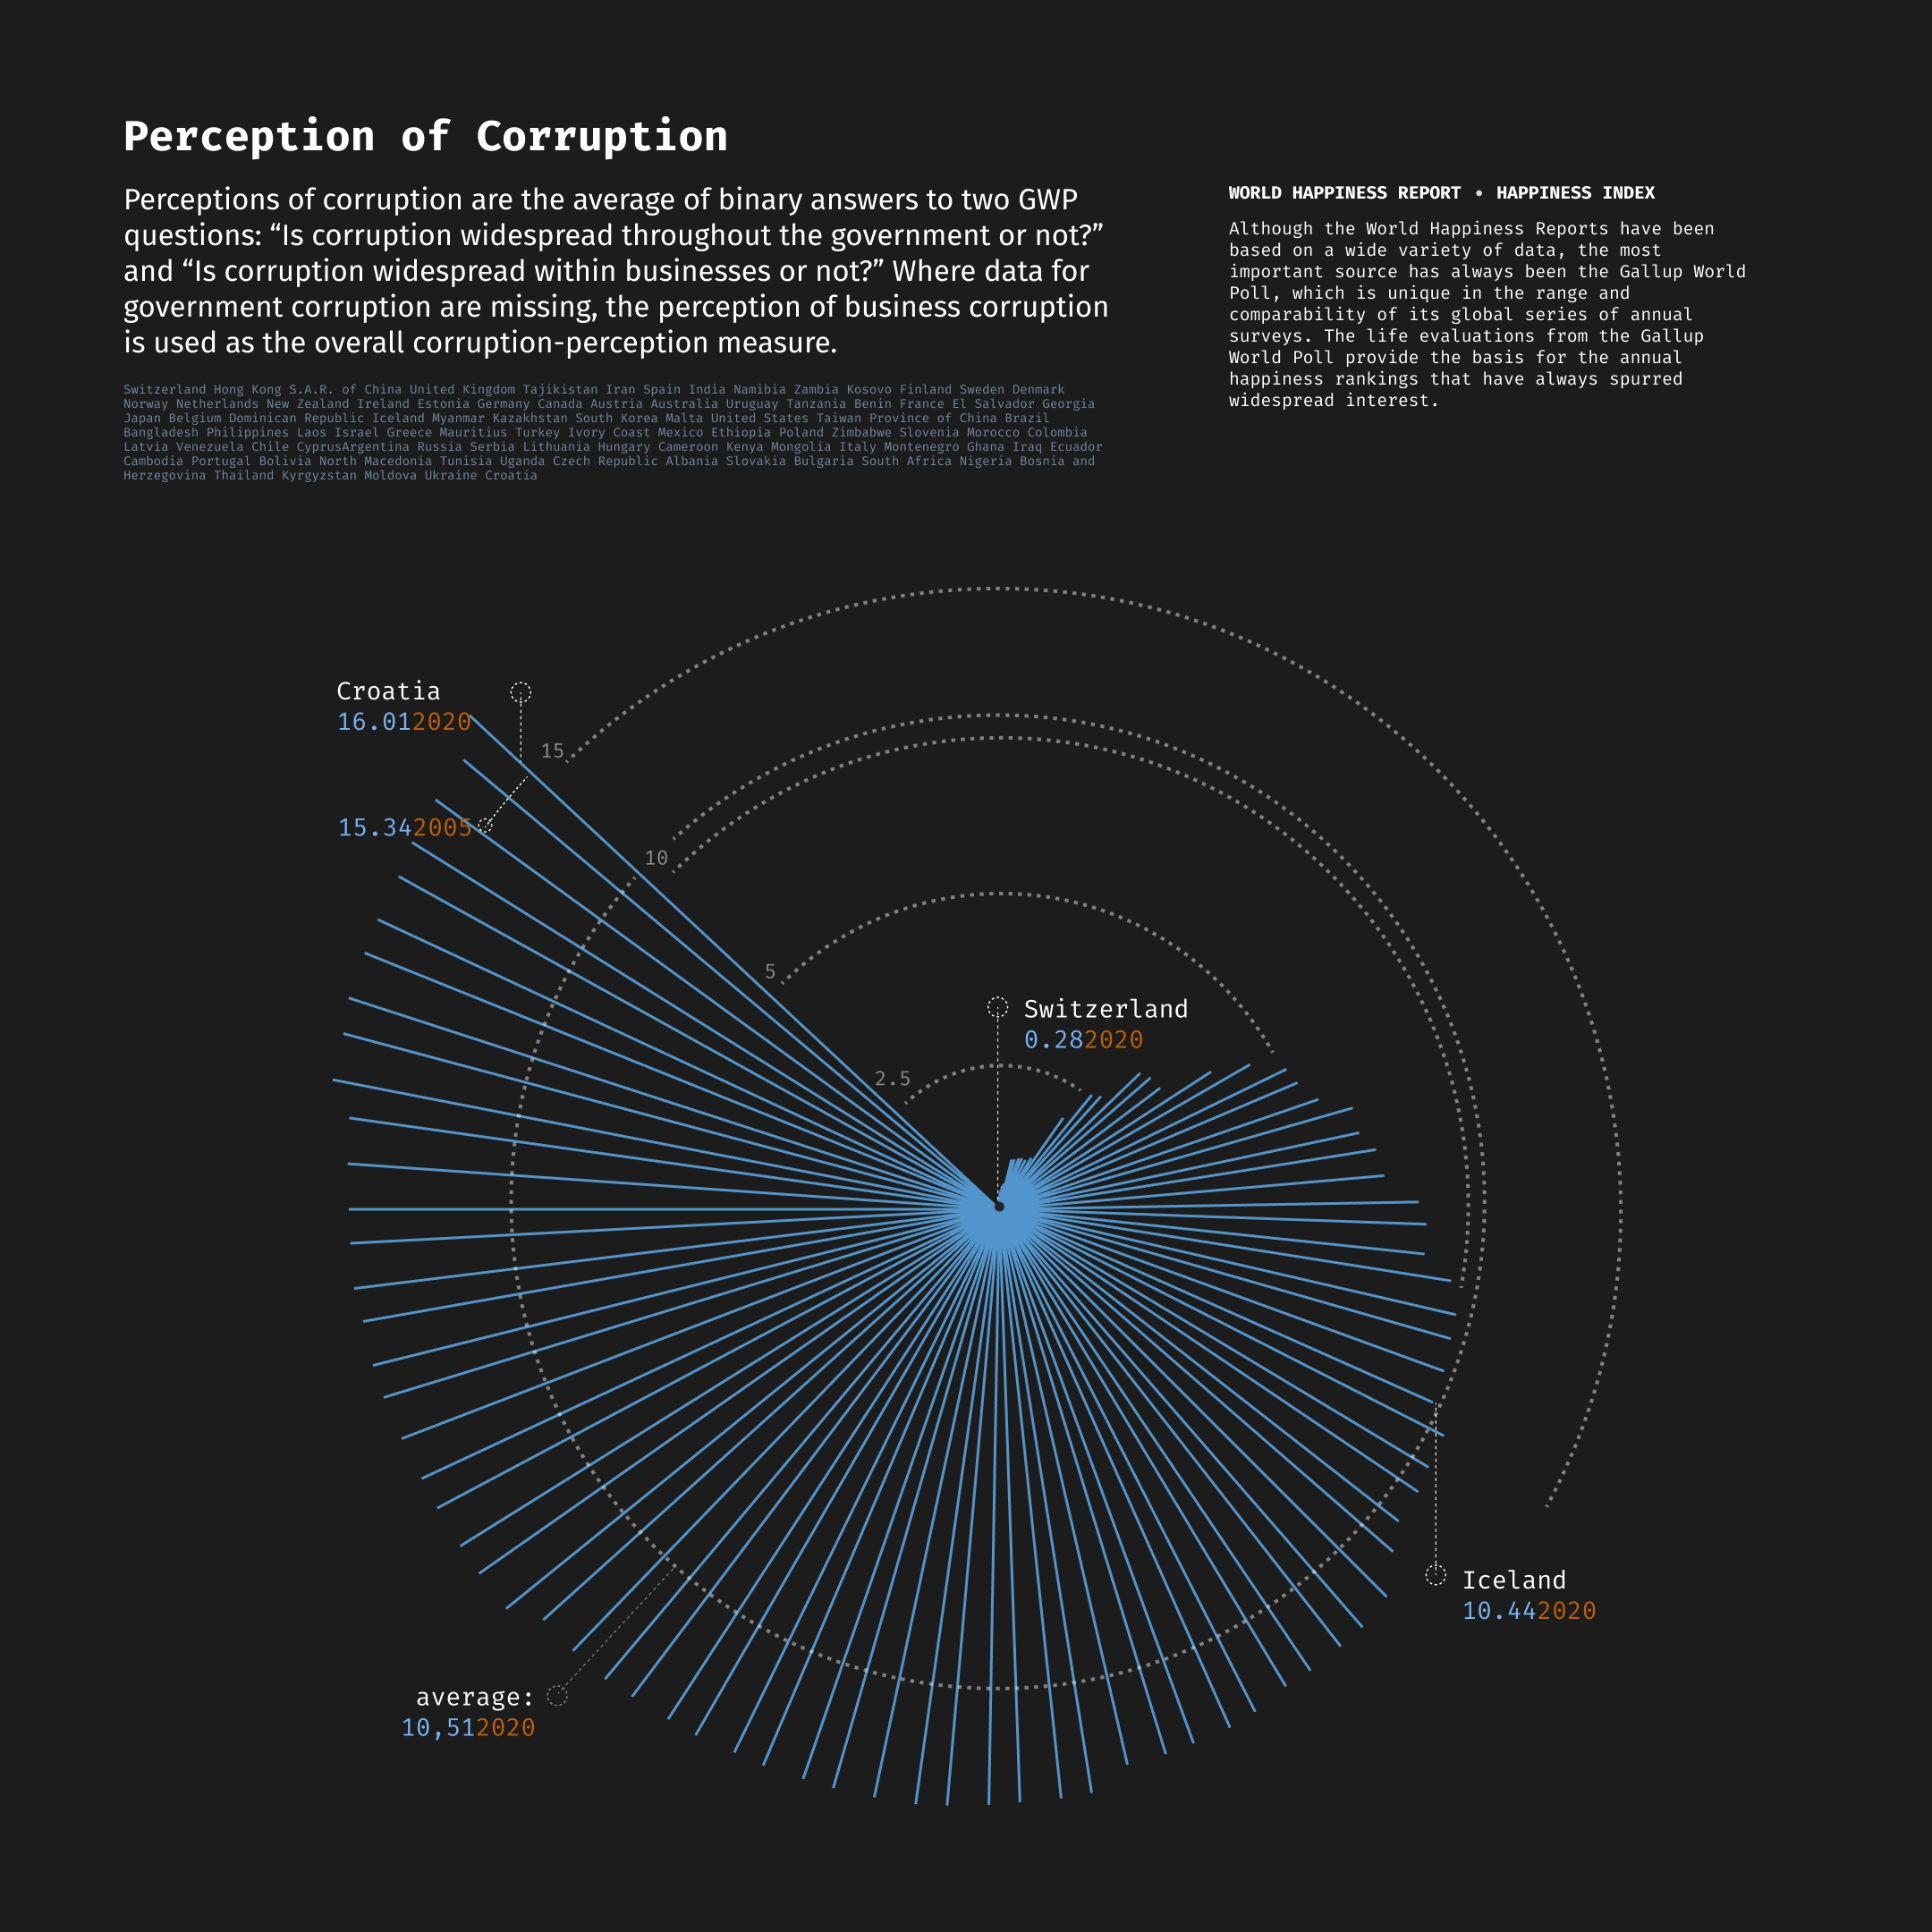
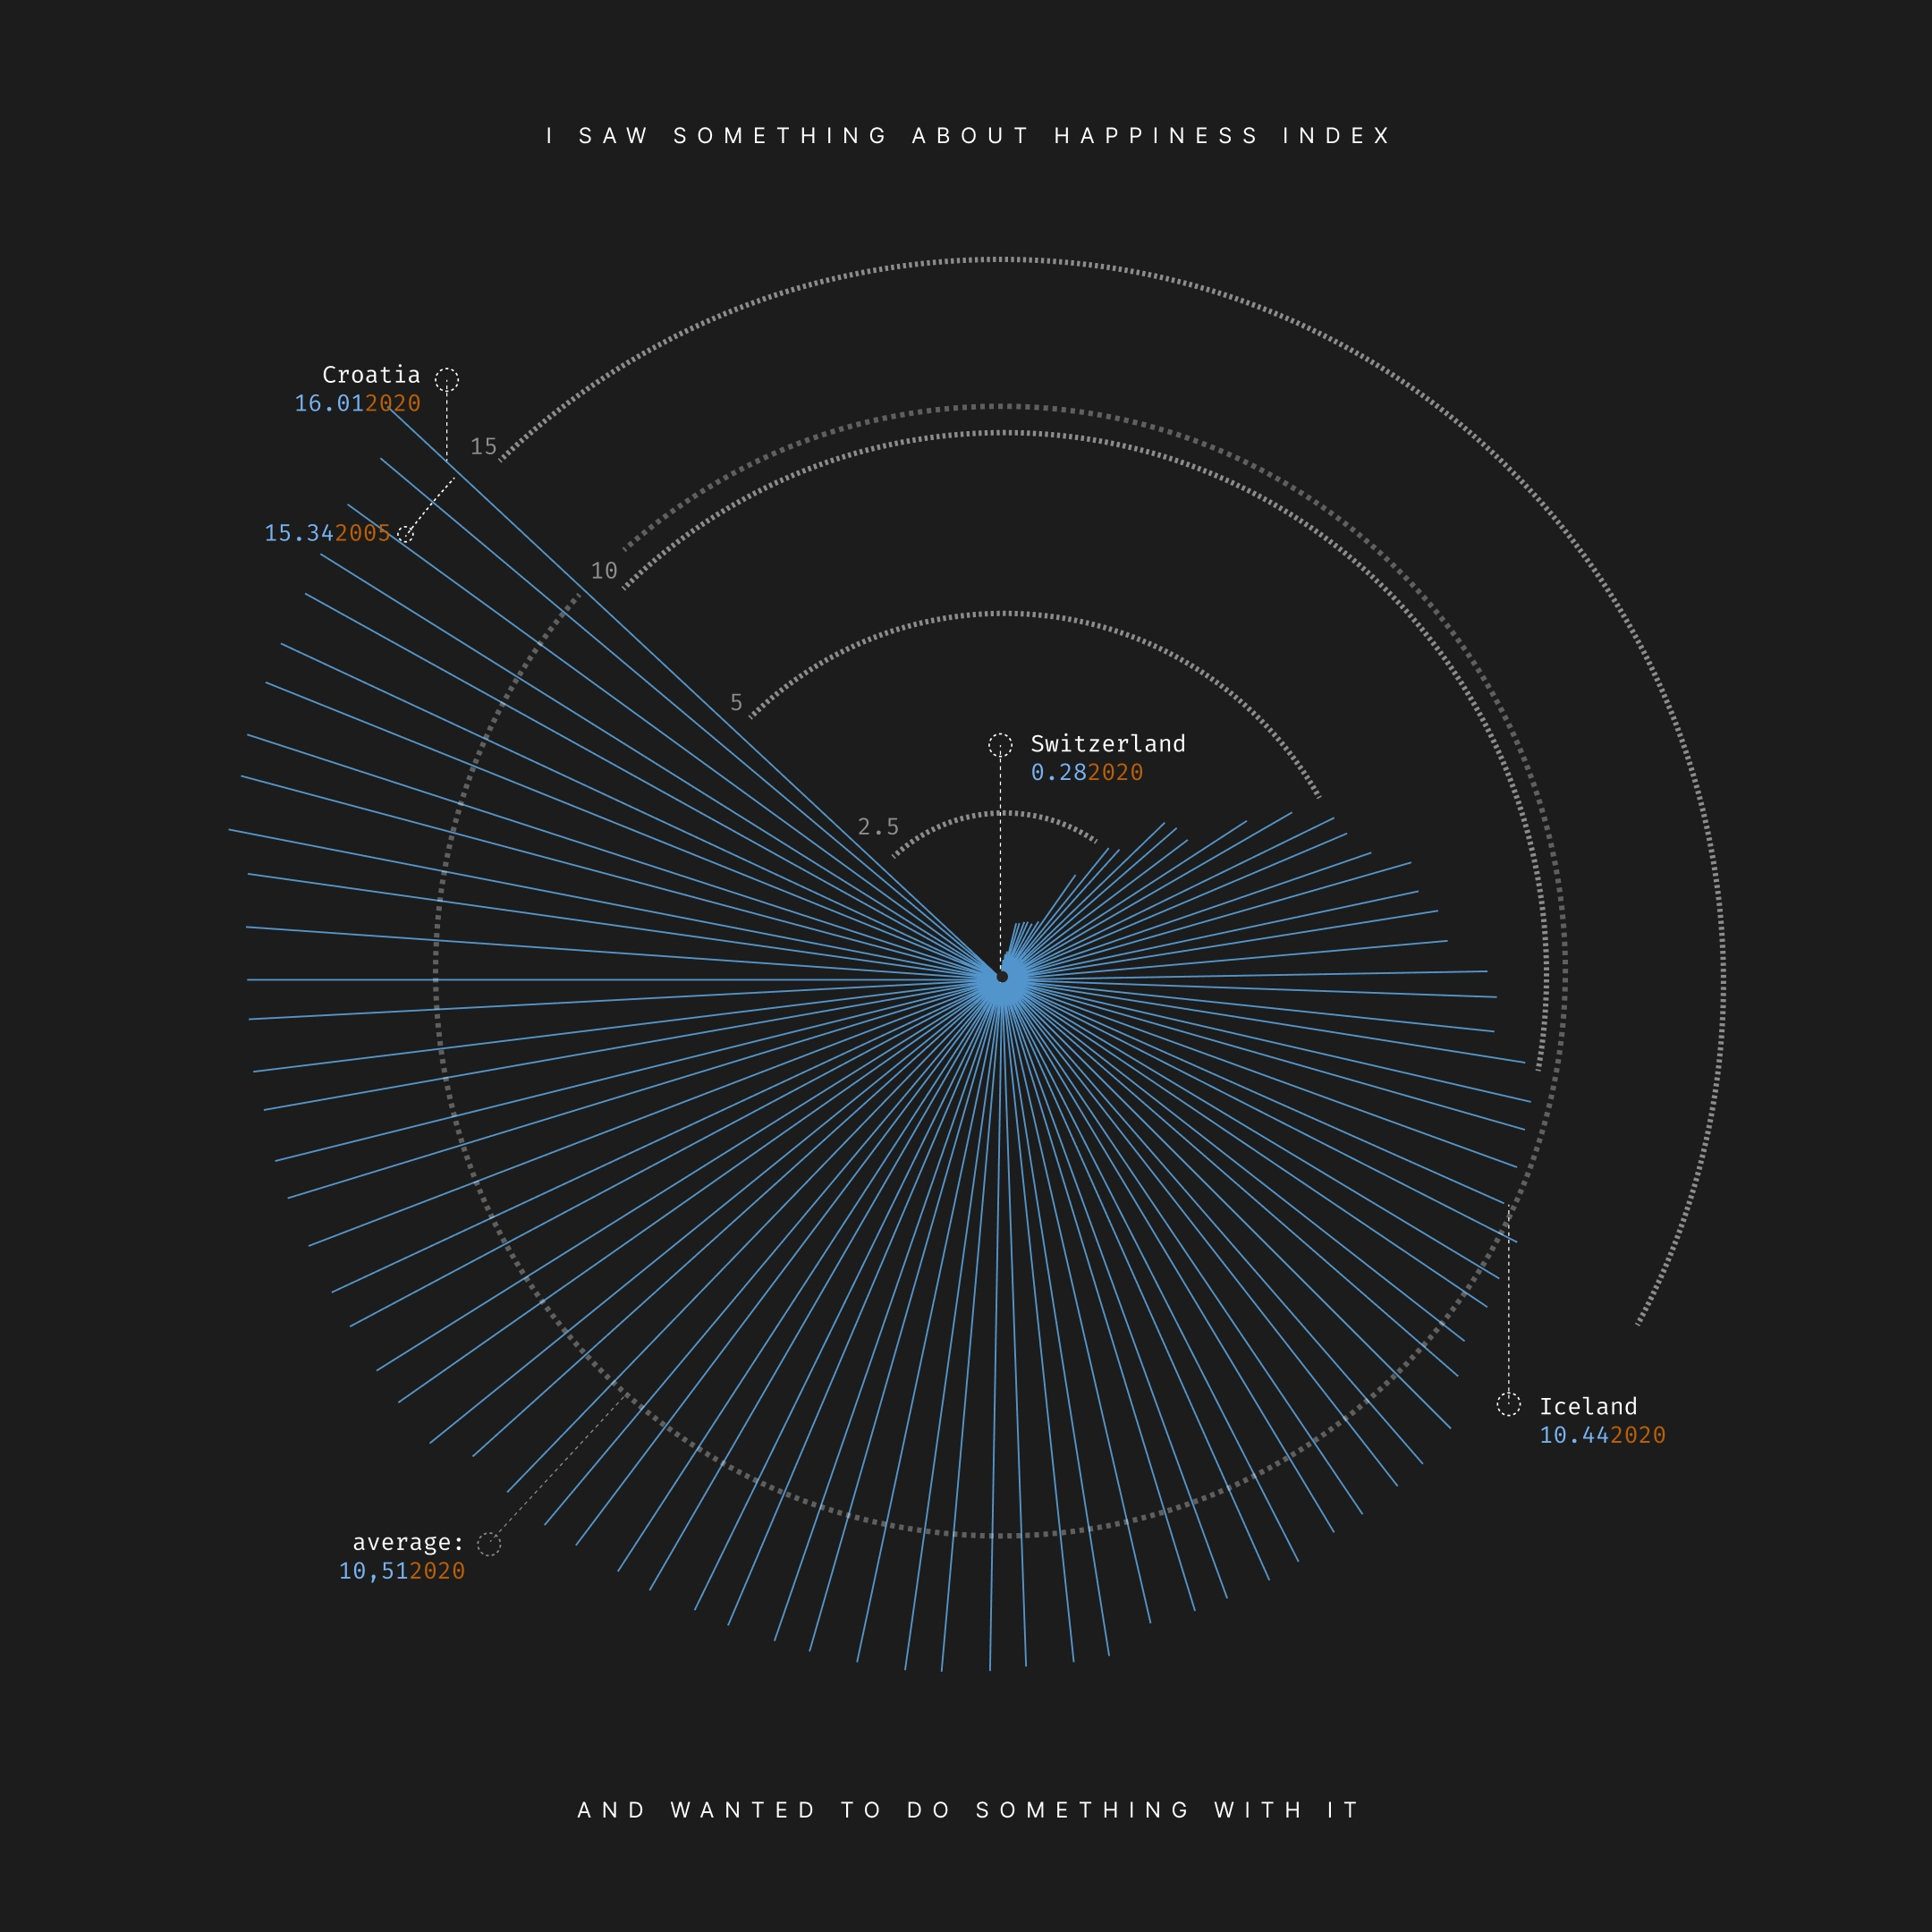
Still influenced by the masterclass, I saw some data about happiness index and made a visualization for that with some inspo in mind.
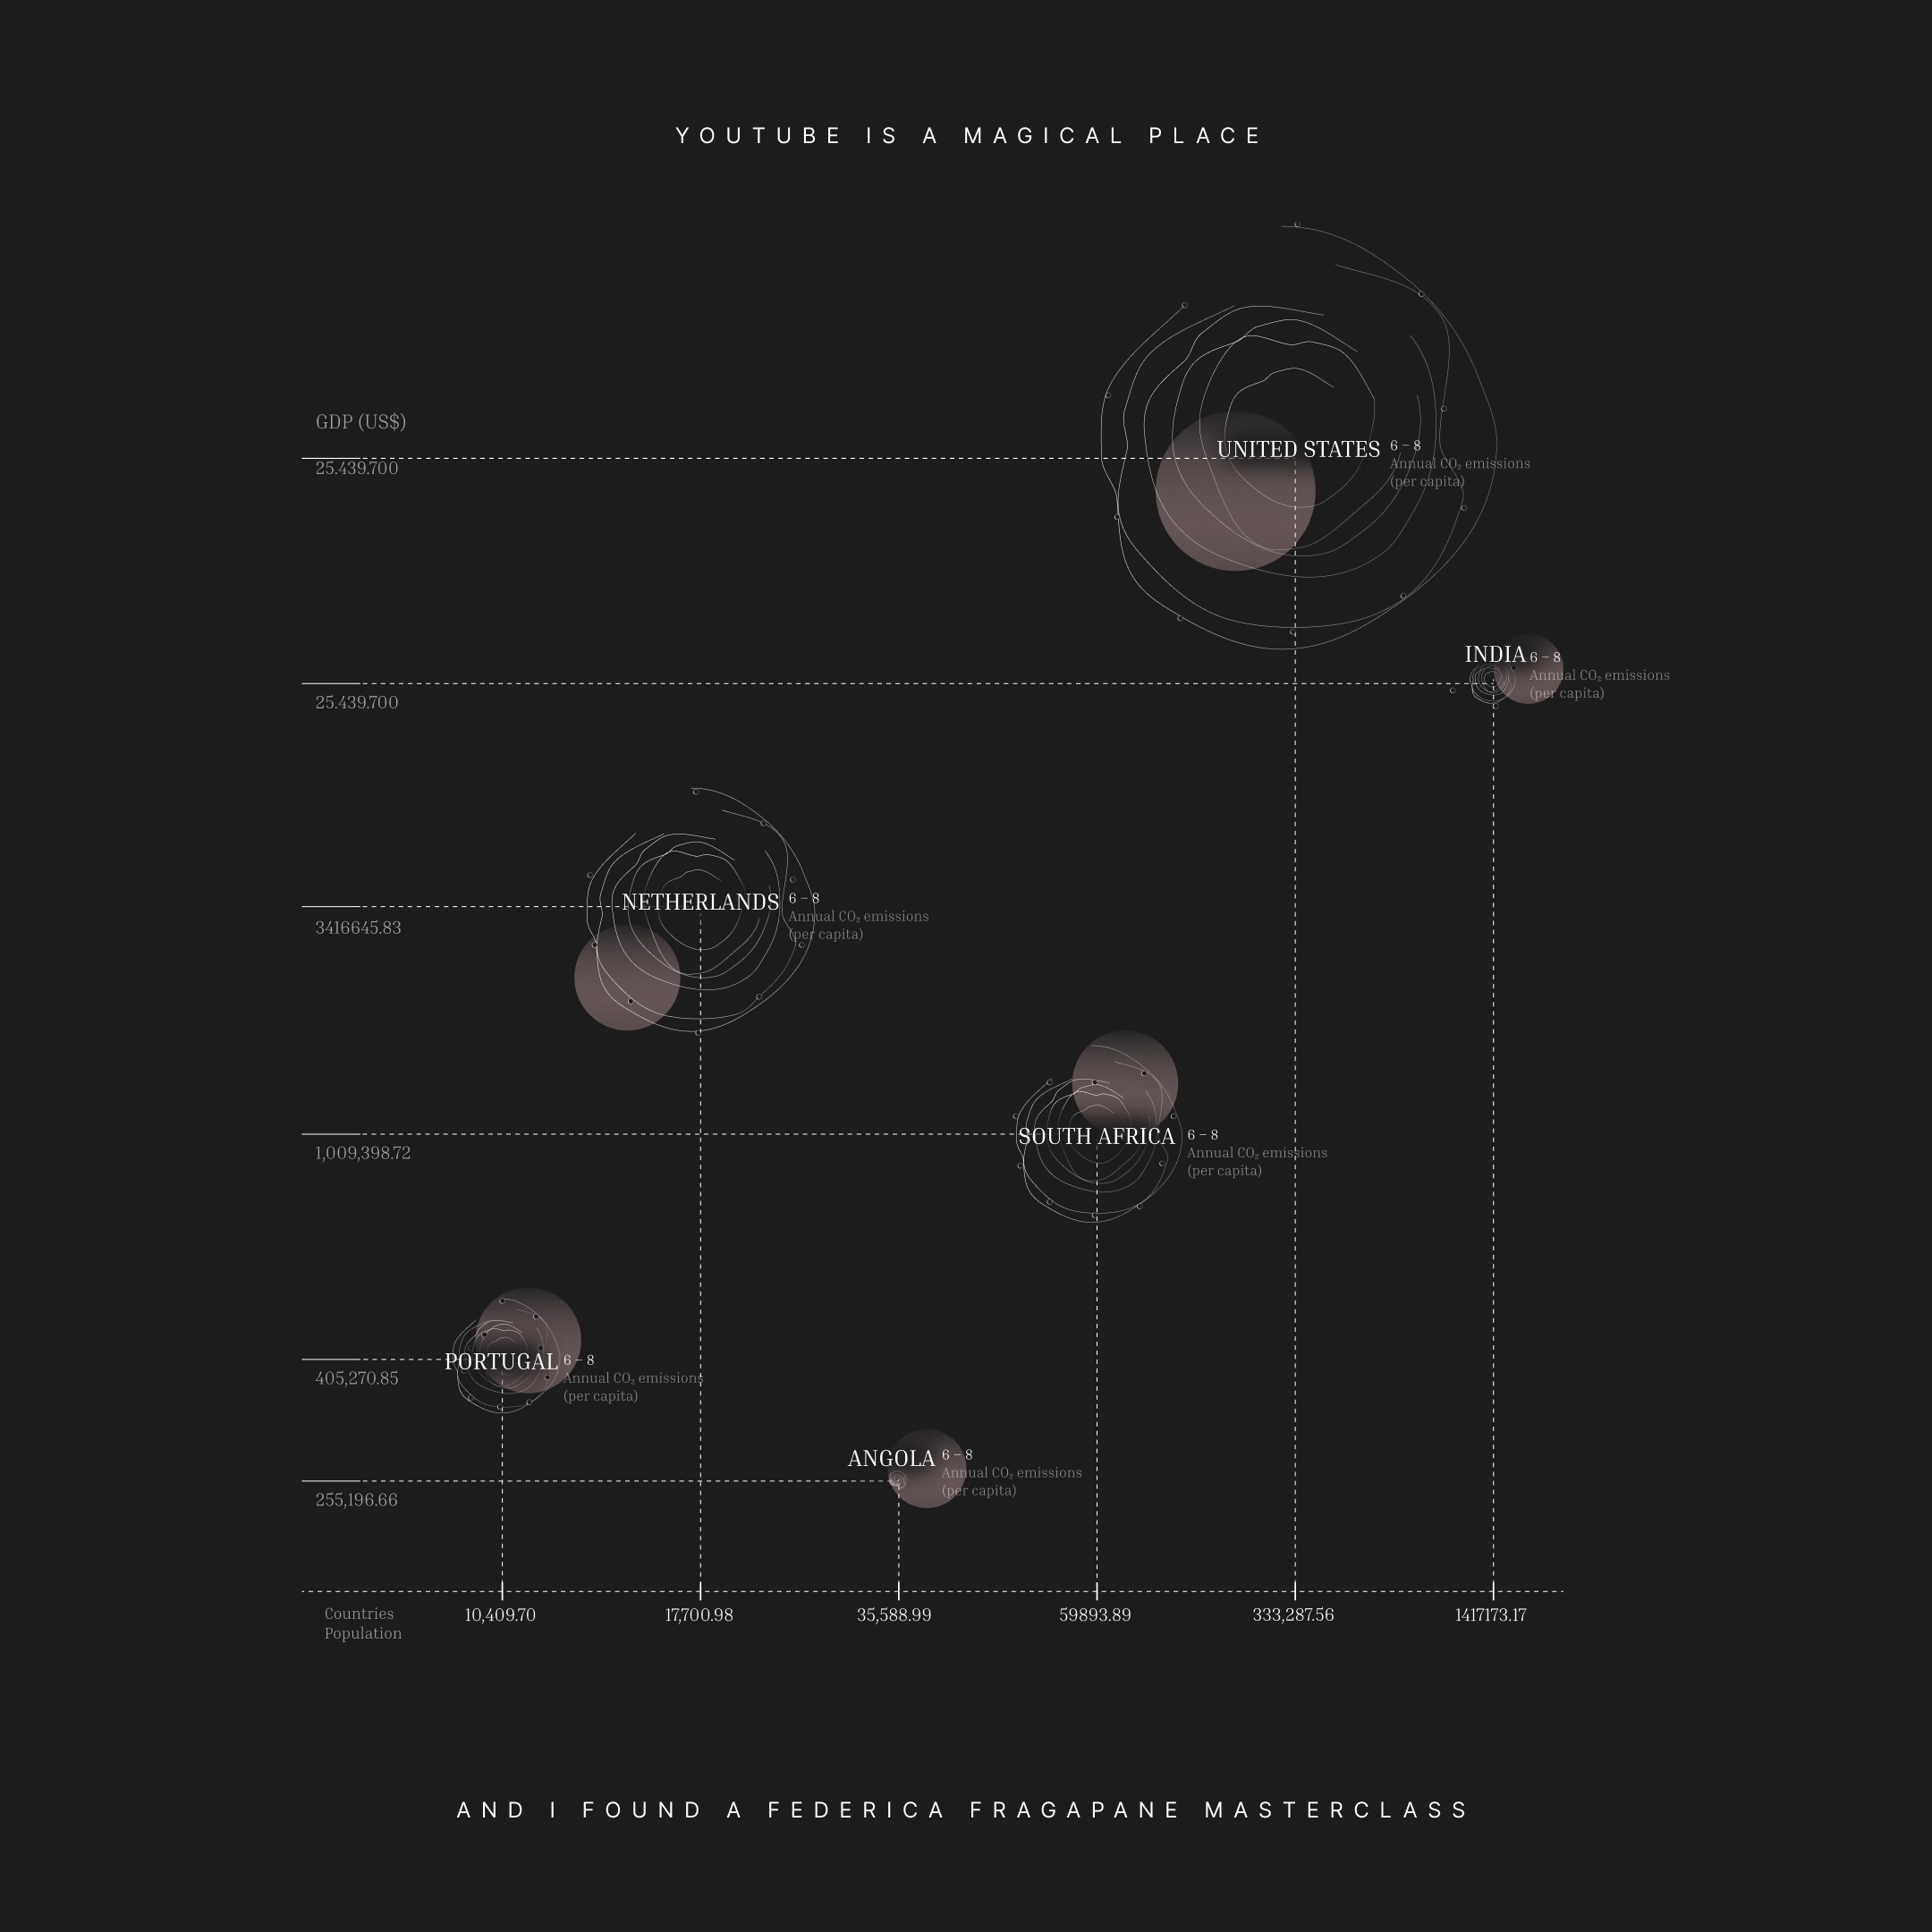
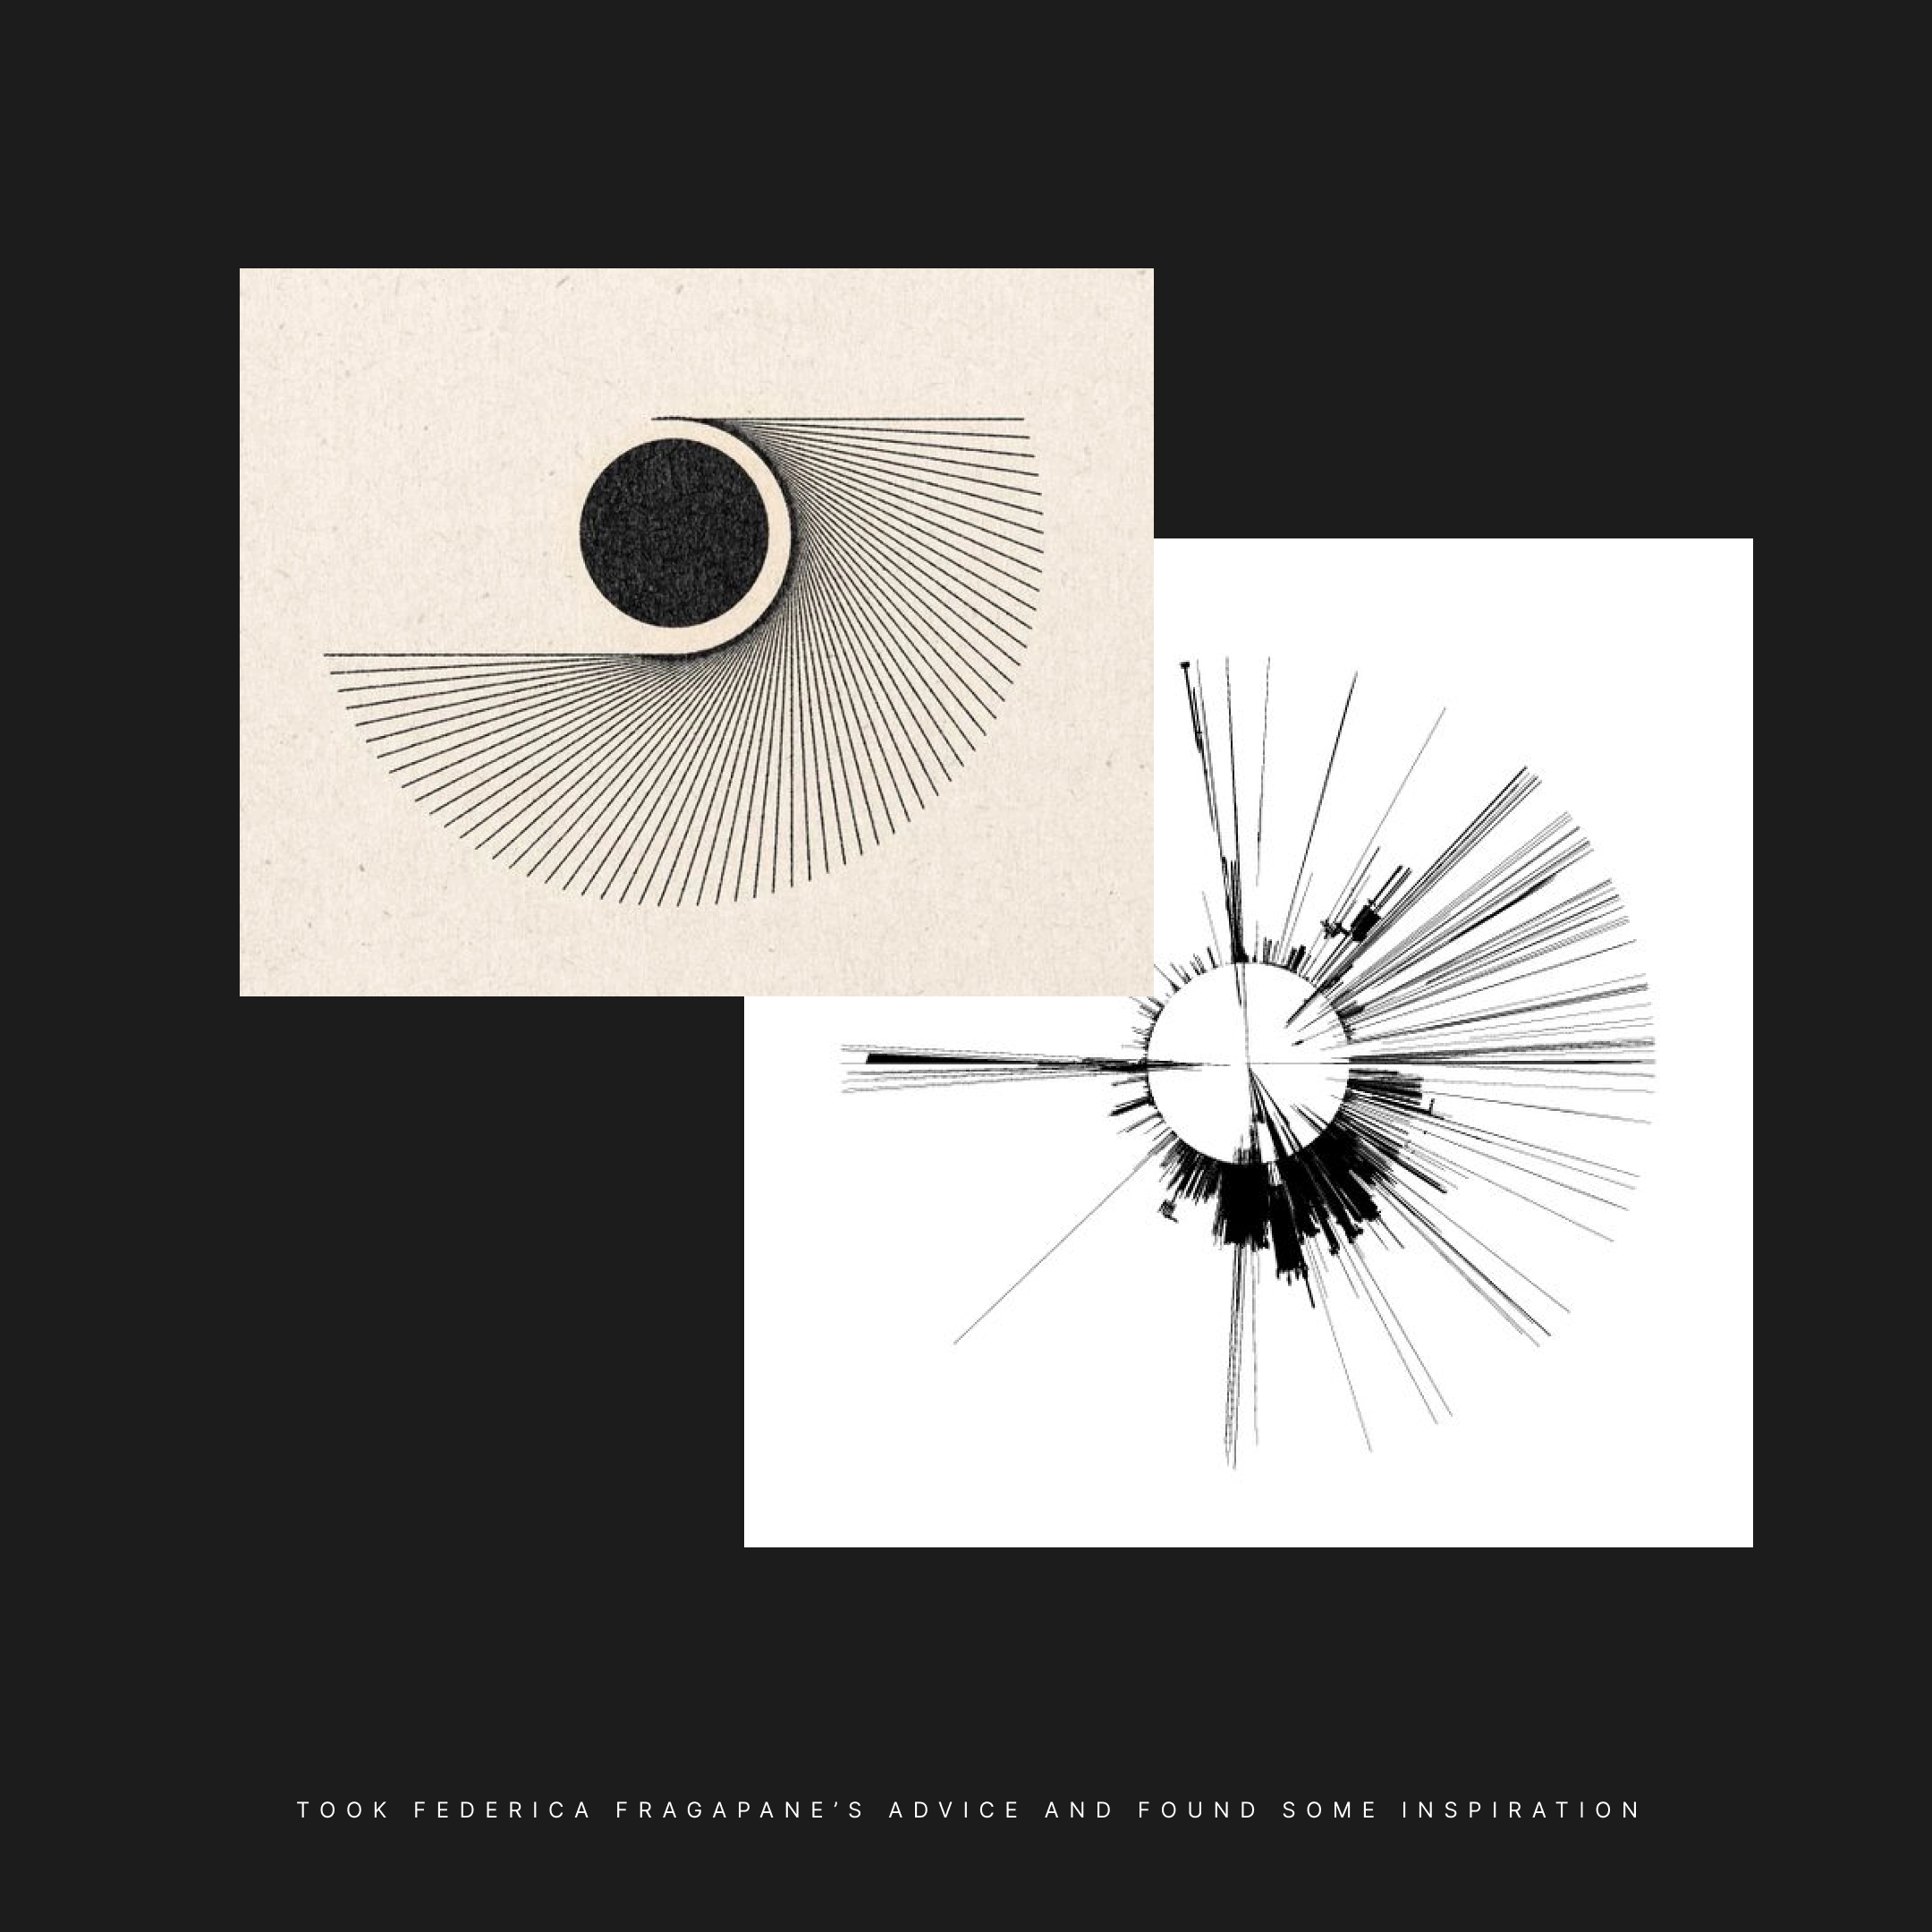
I followed a masterclass from Frederica Fragapane and made something.
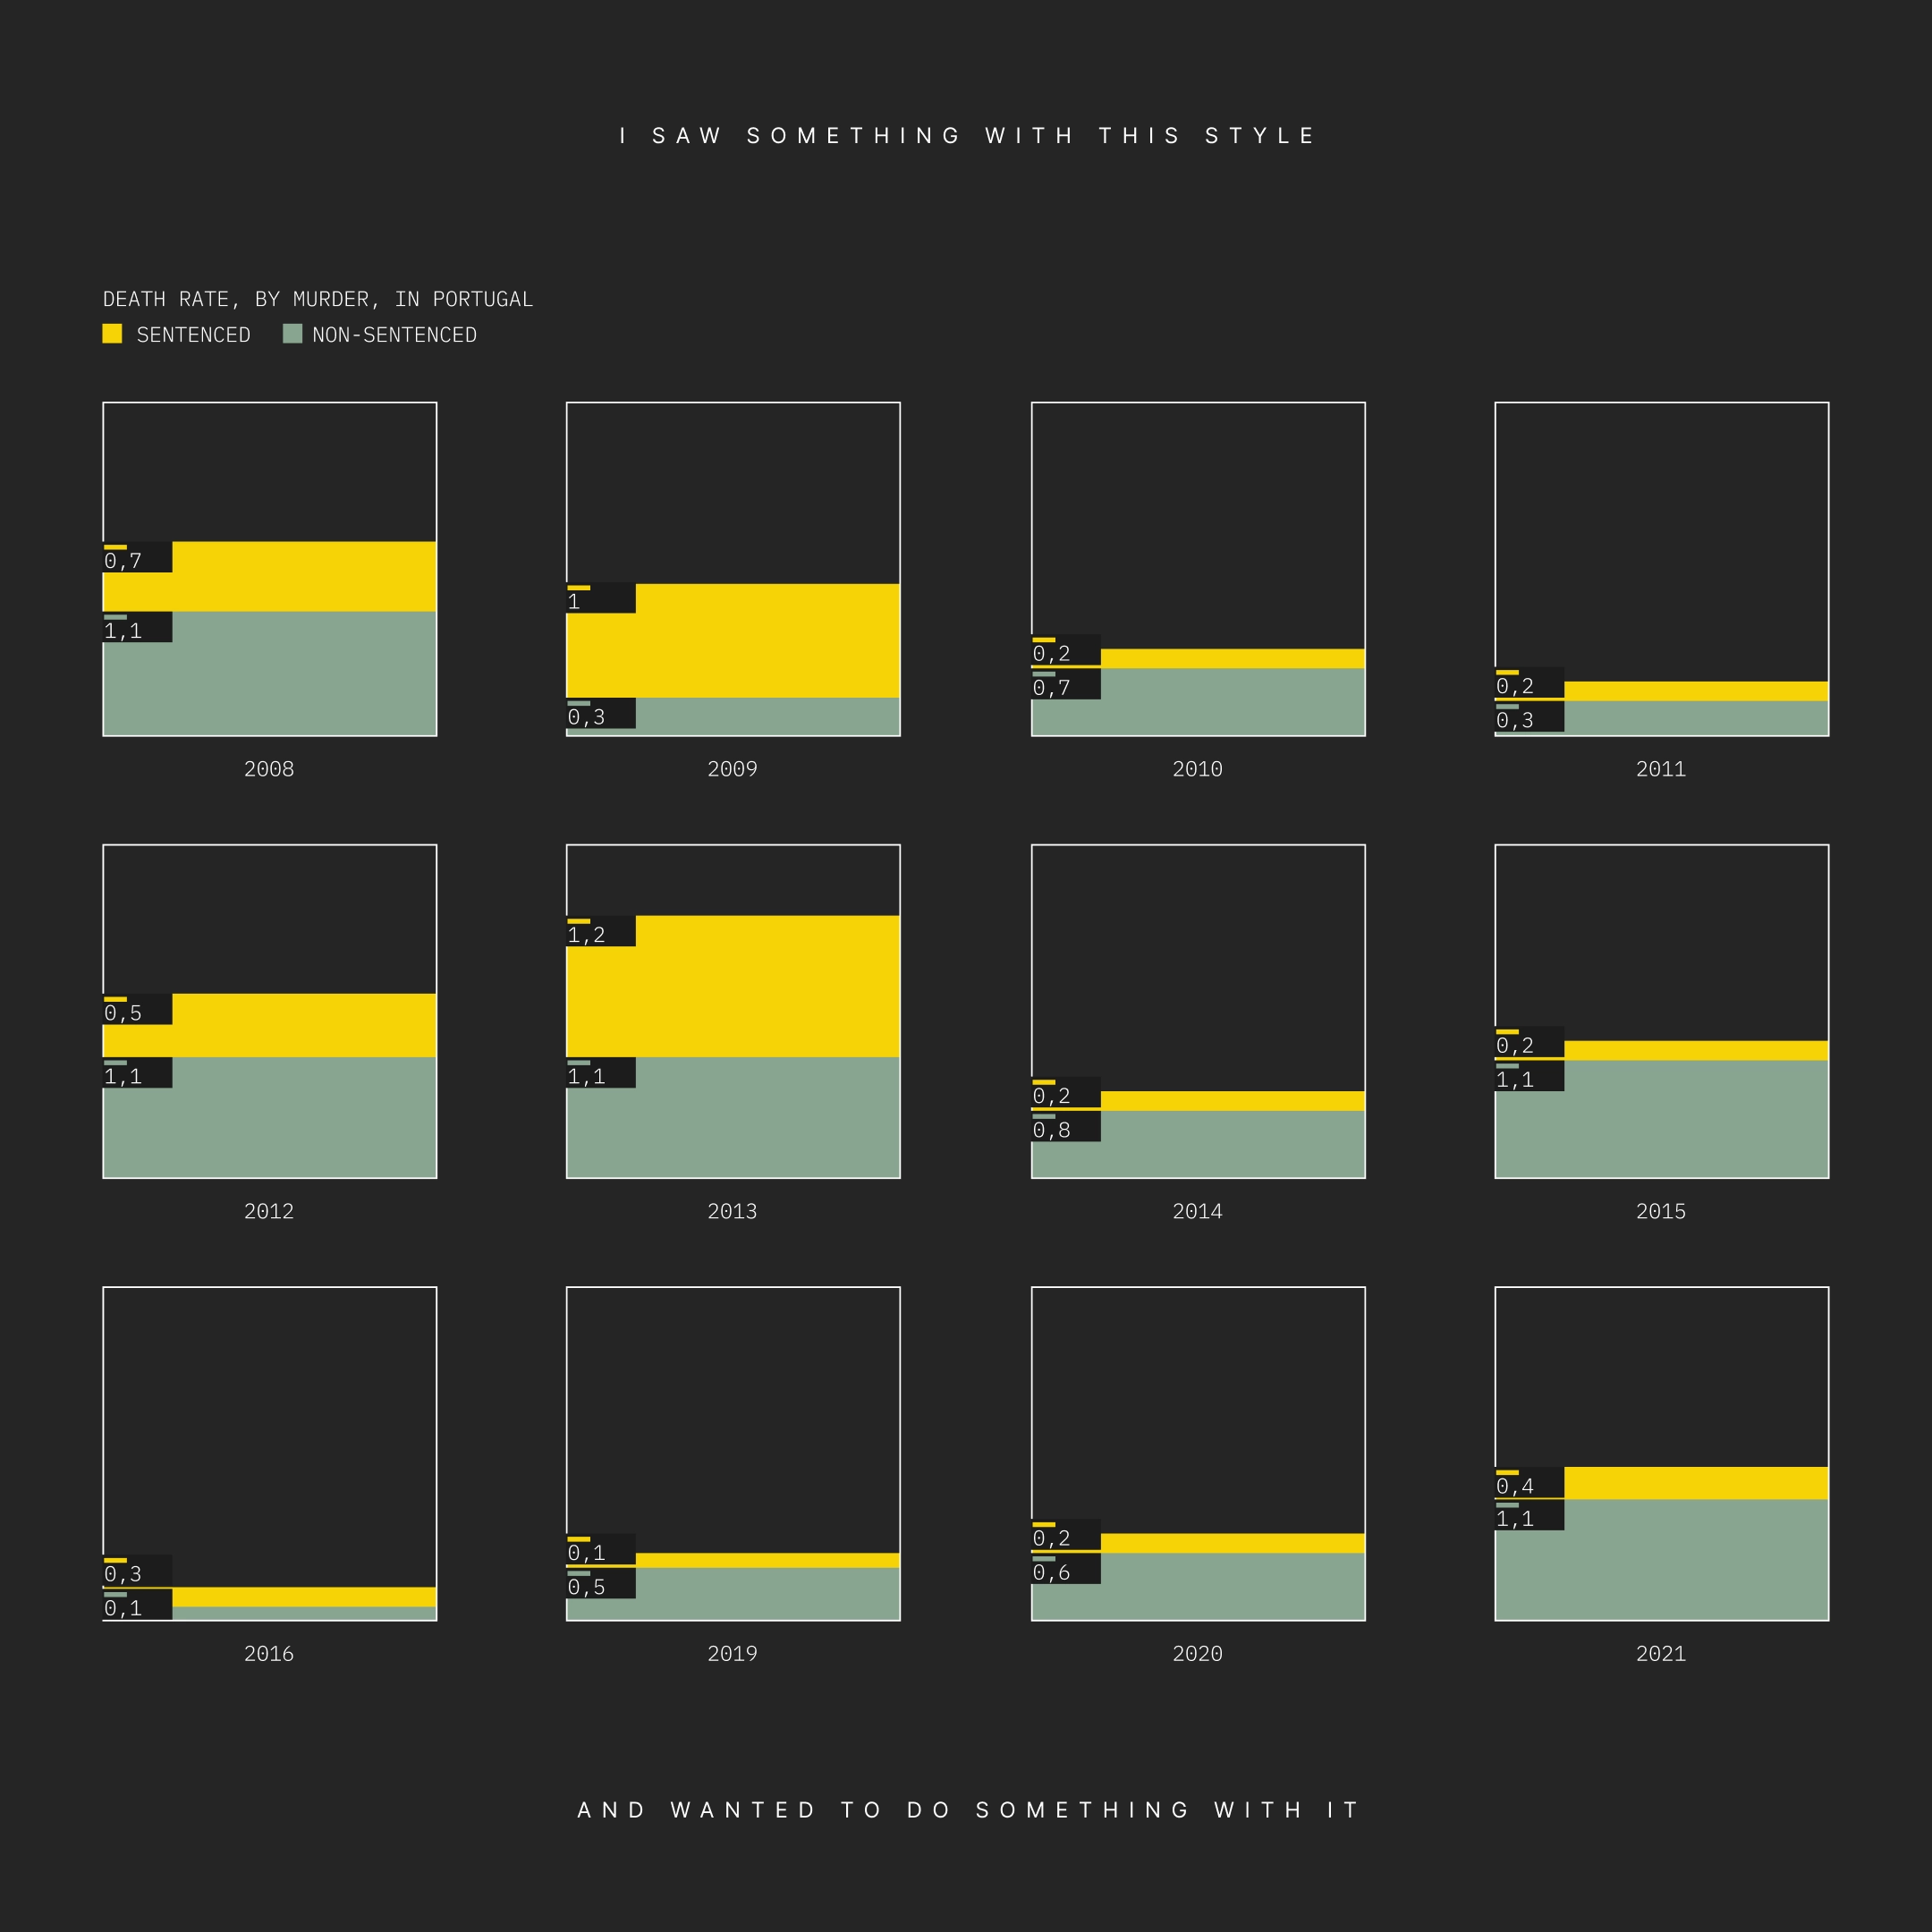
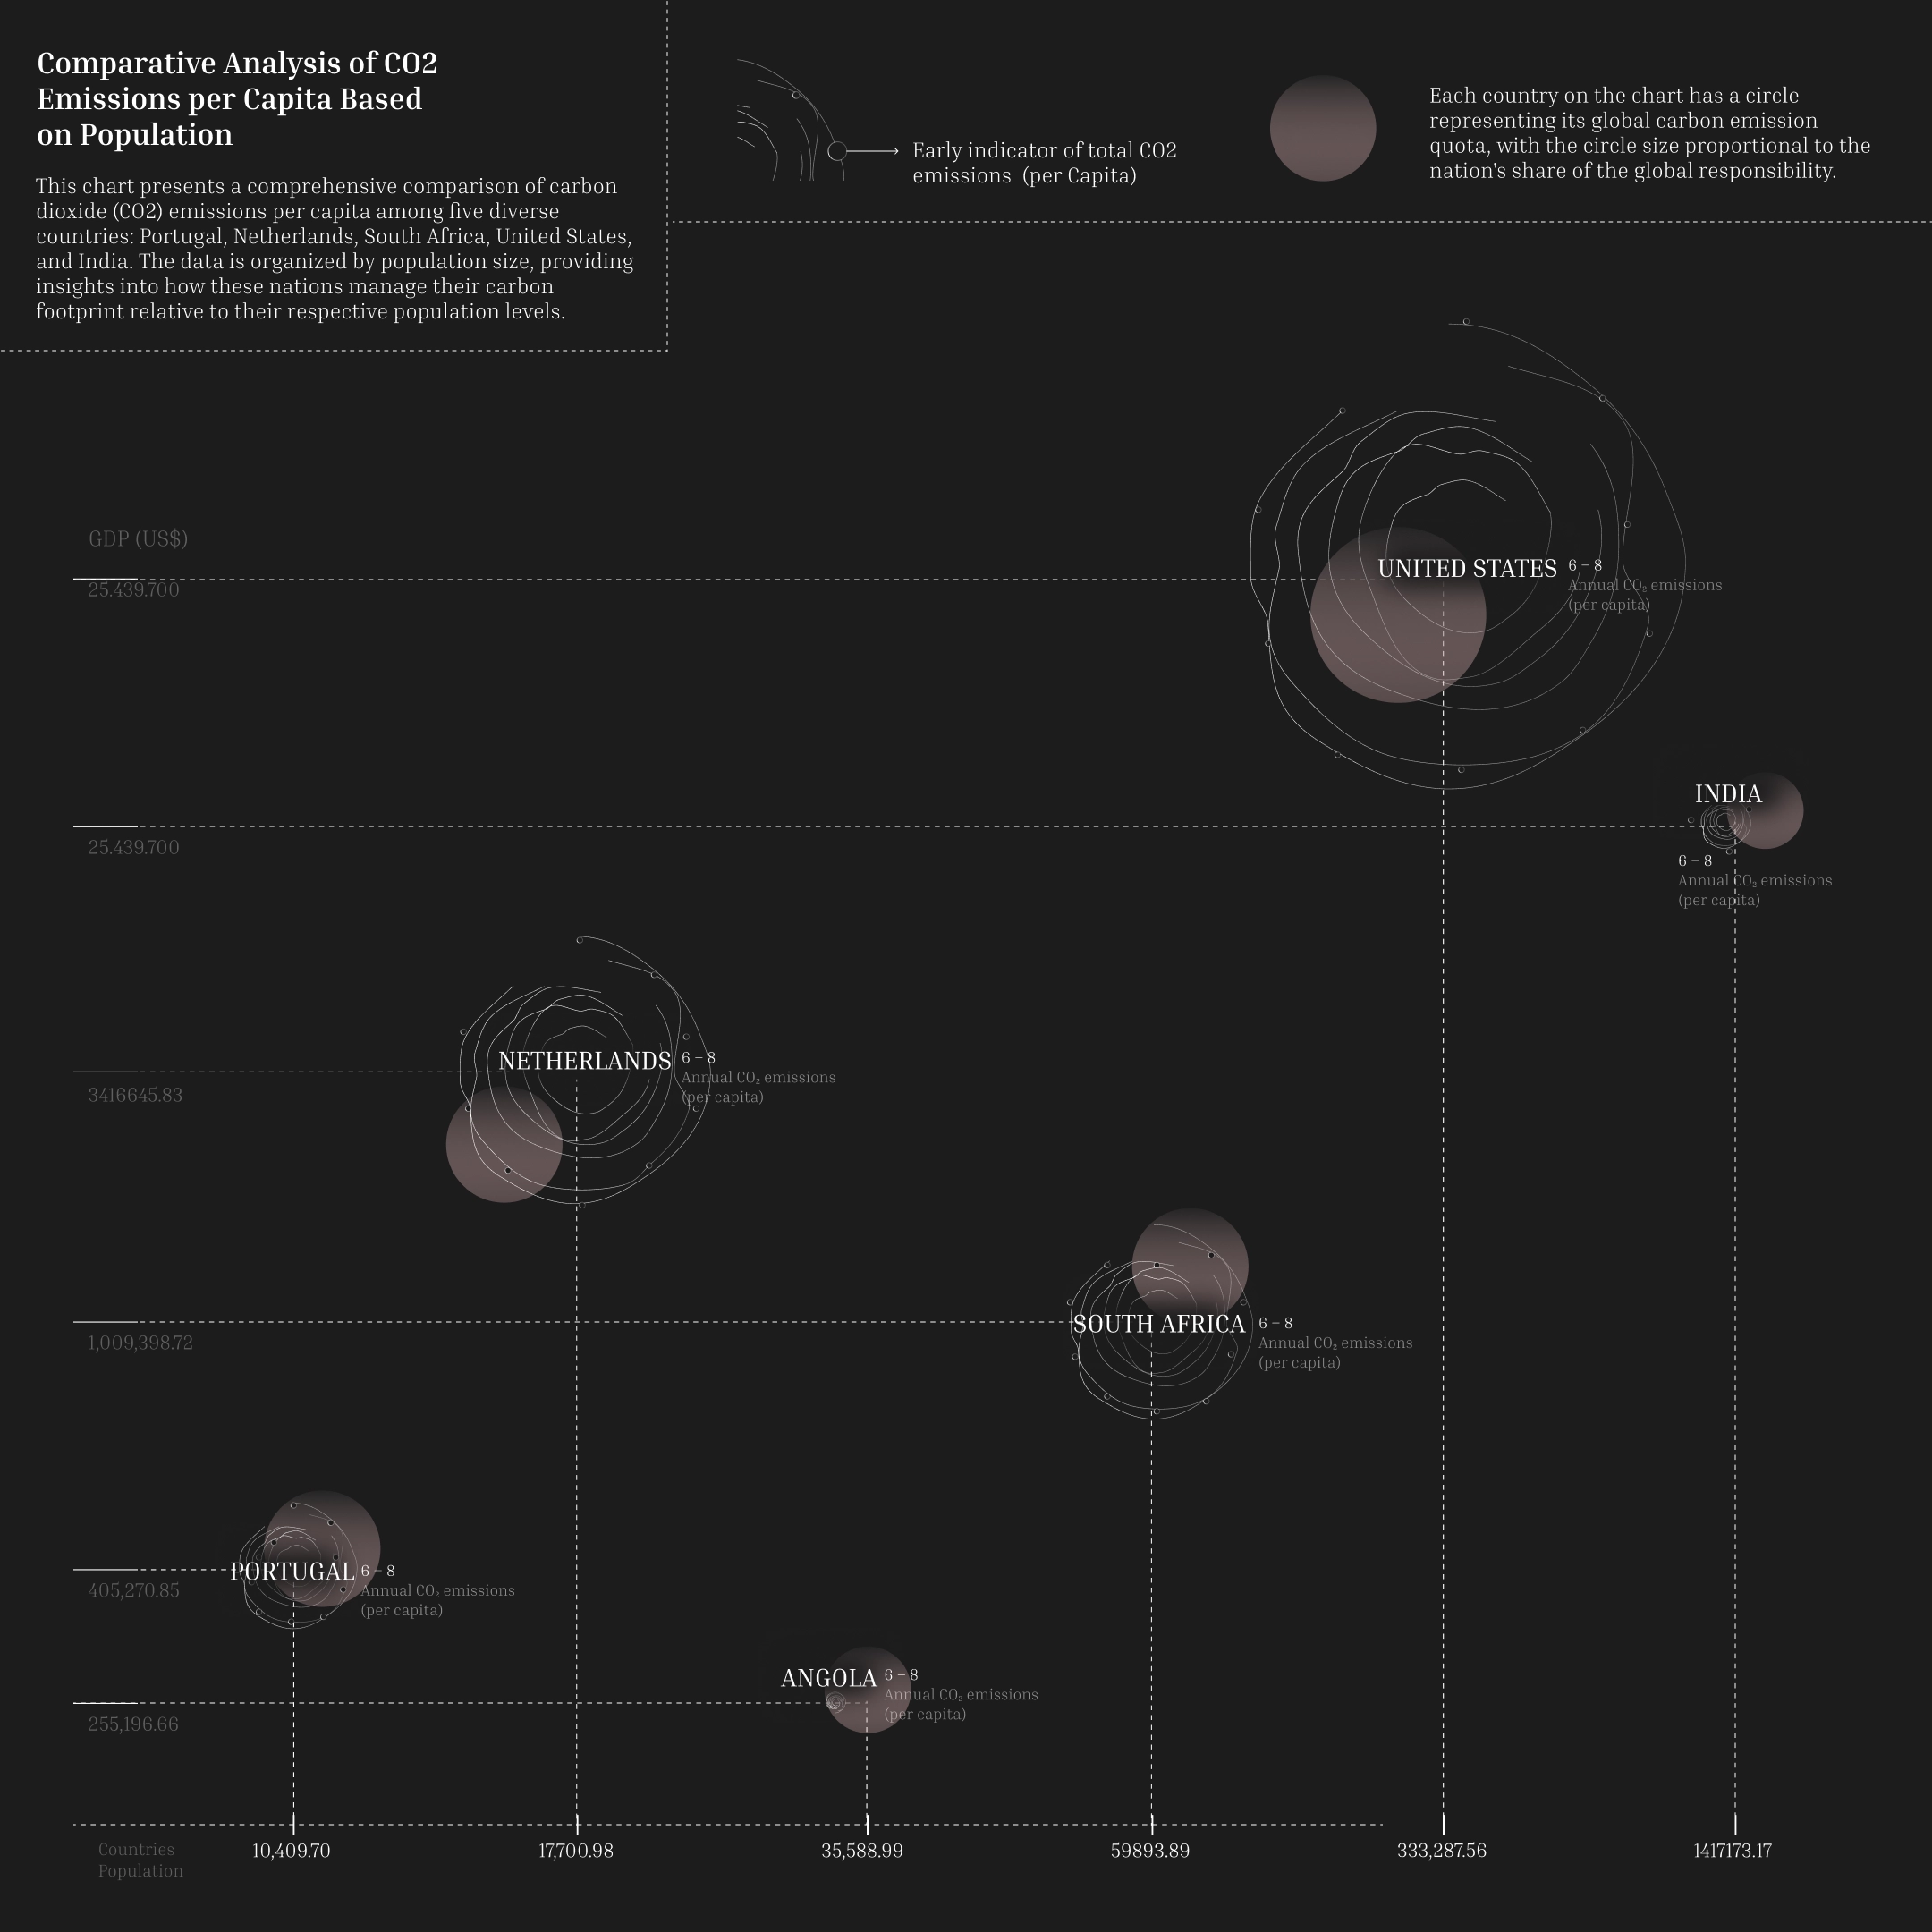
I saw something with this style and wanted to do something with it so I found a dataset.
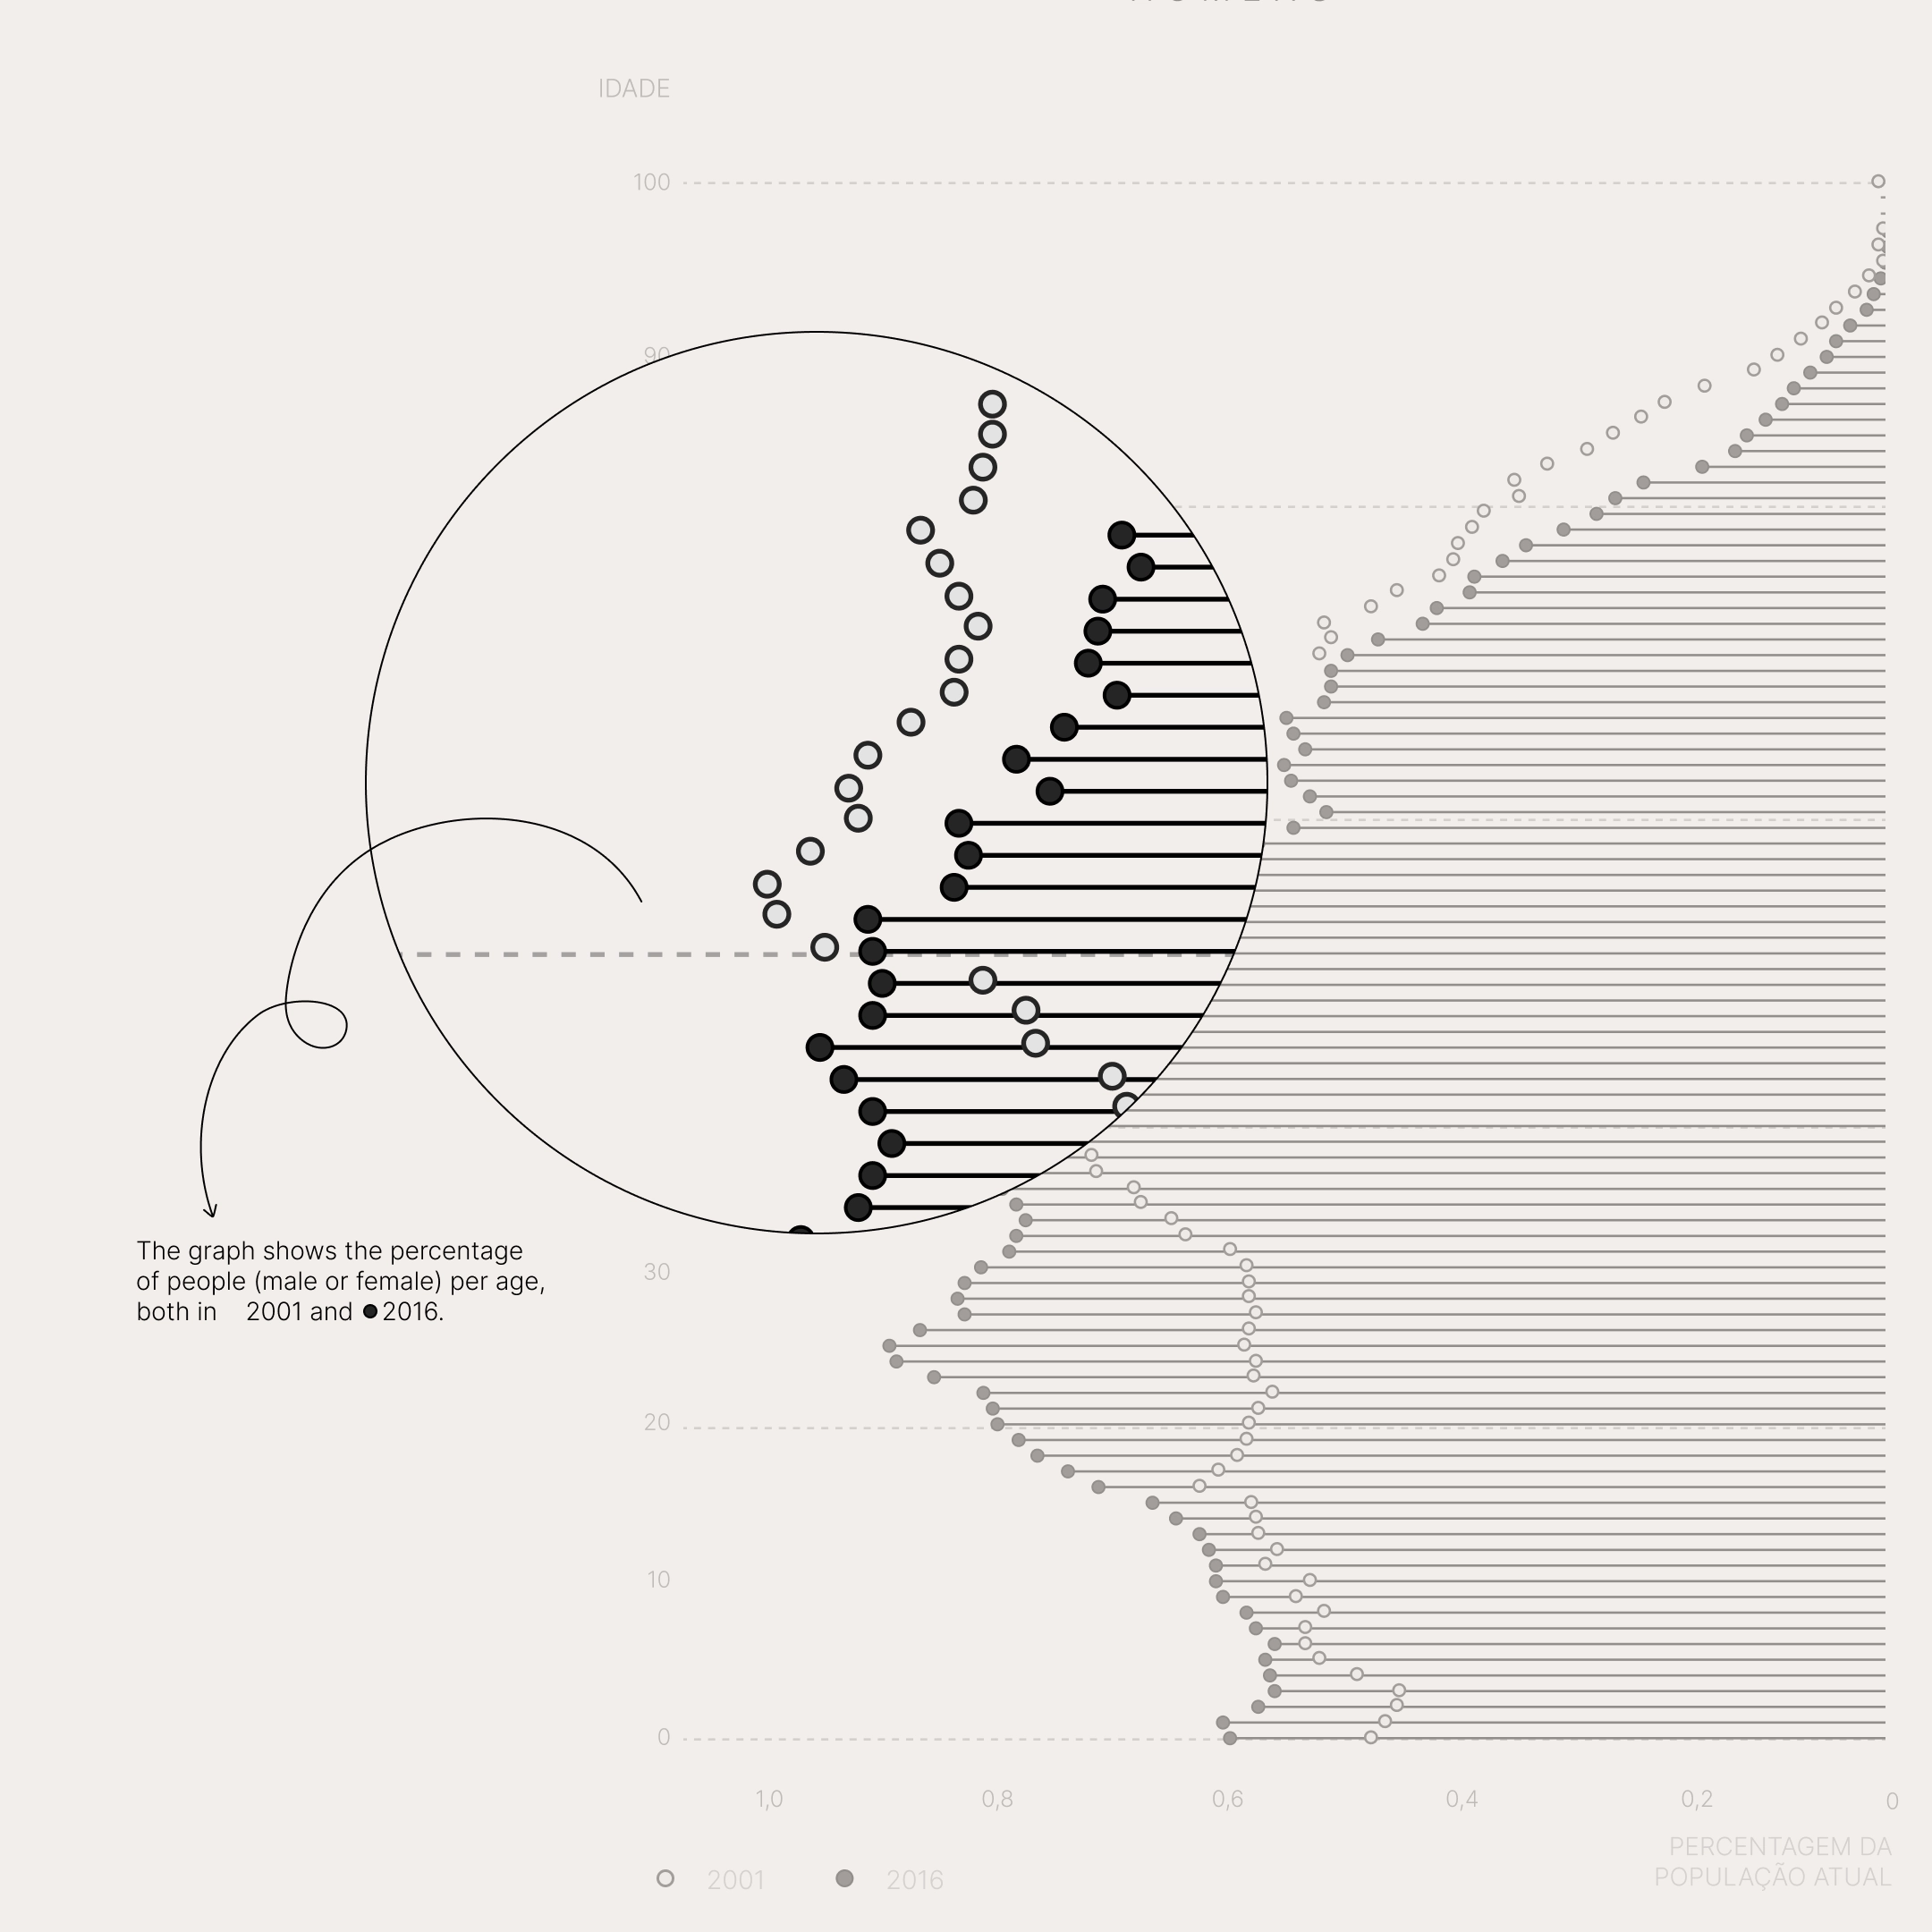
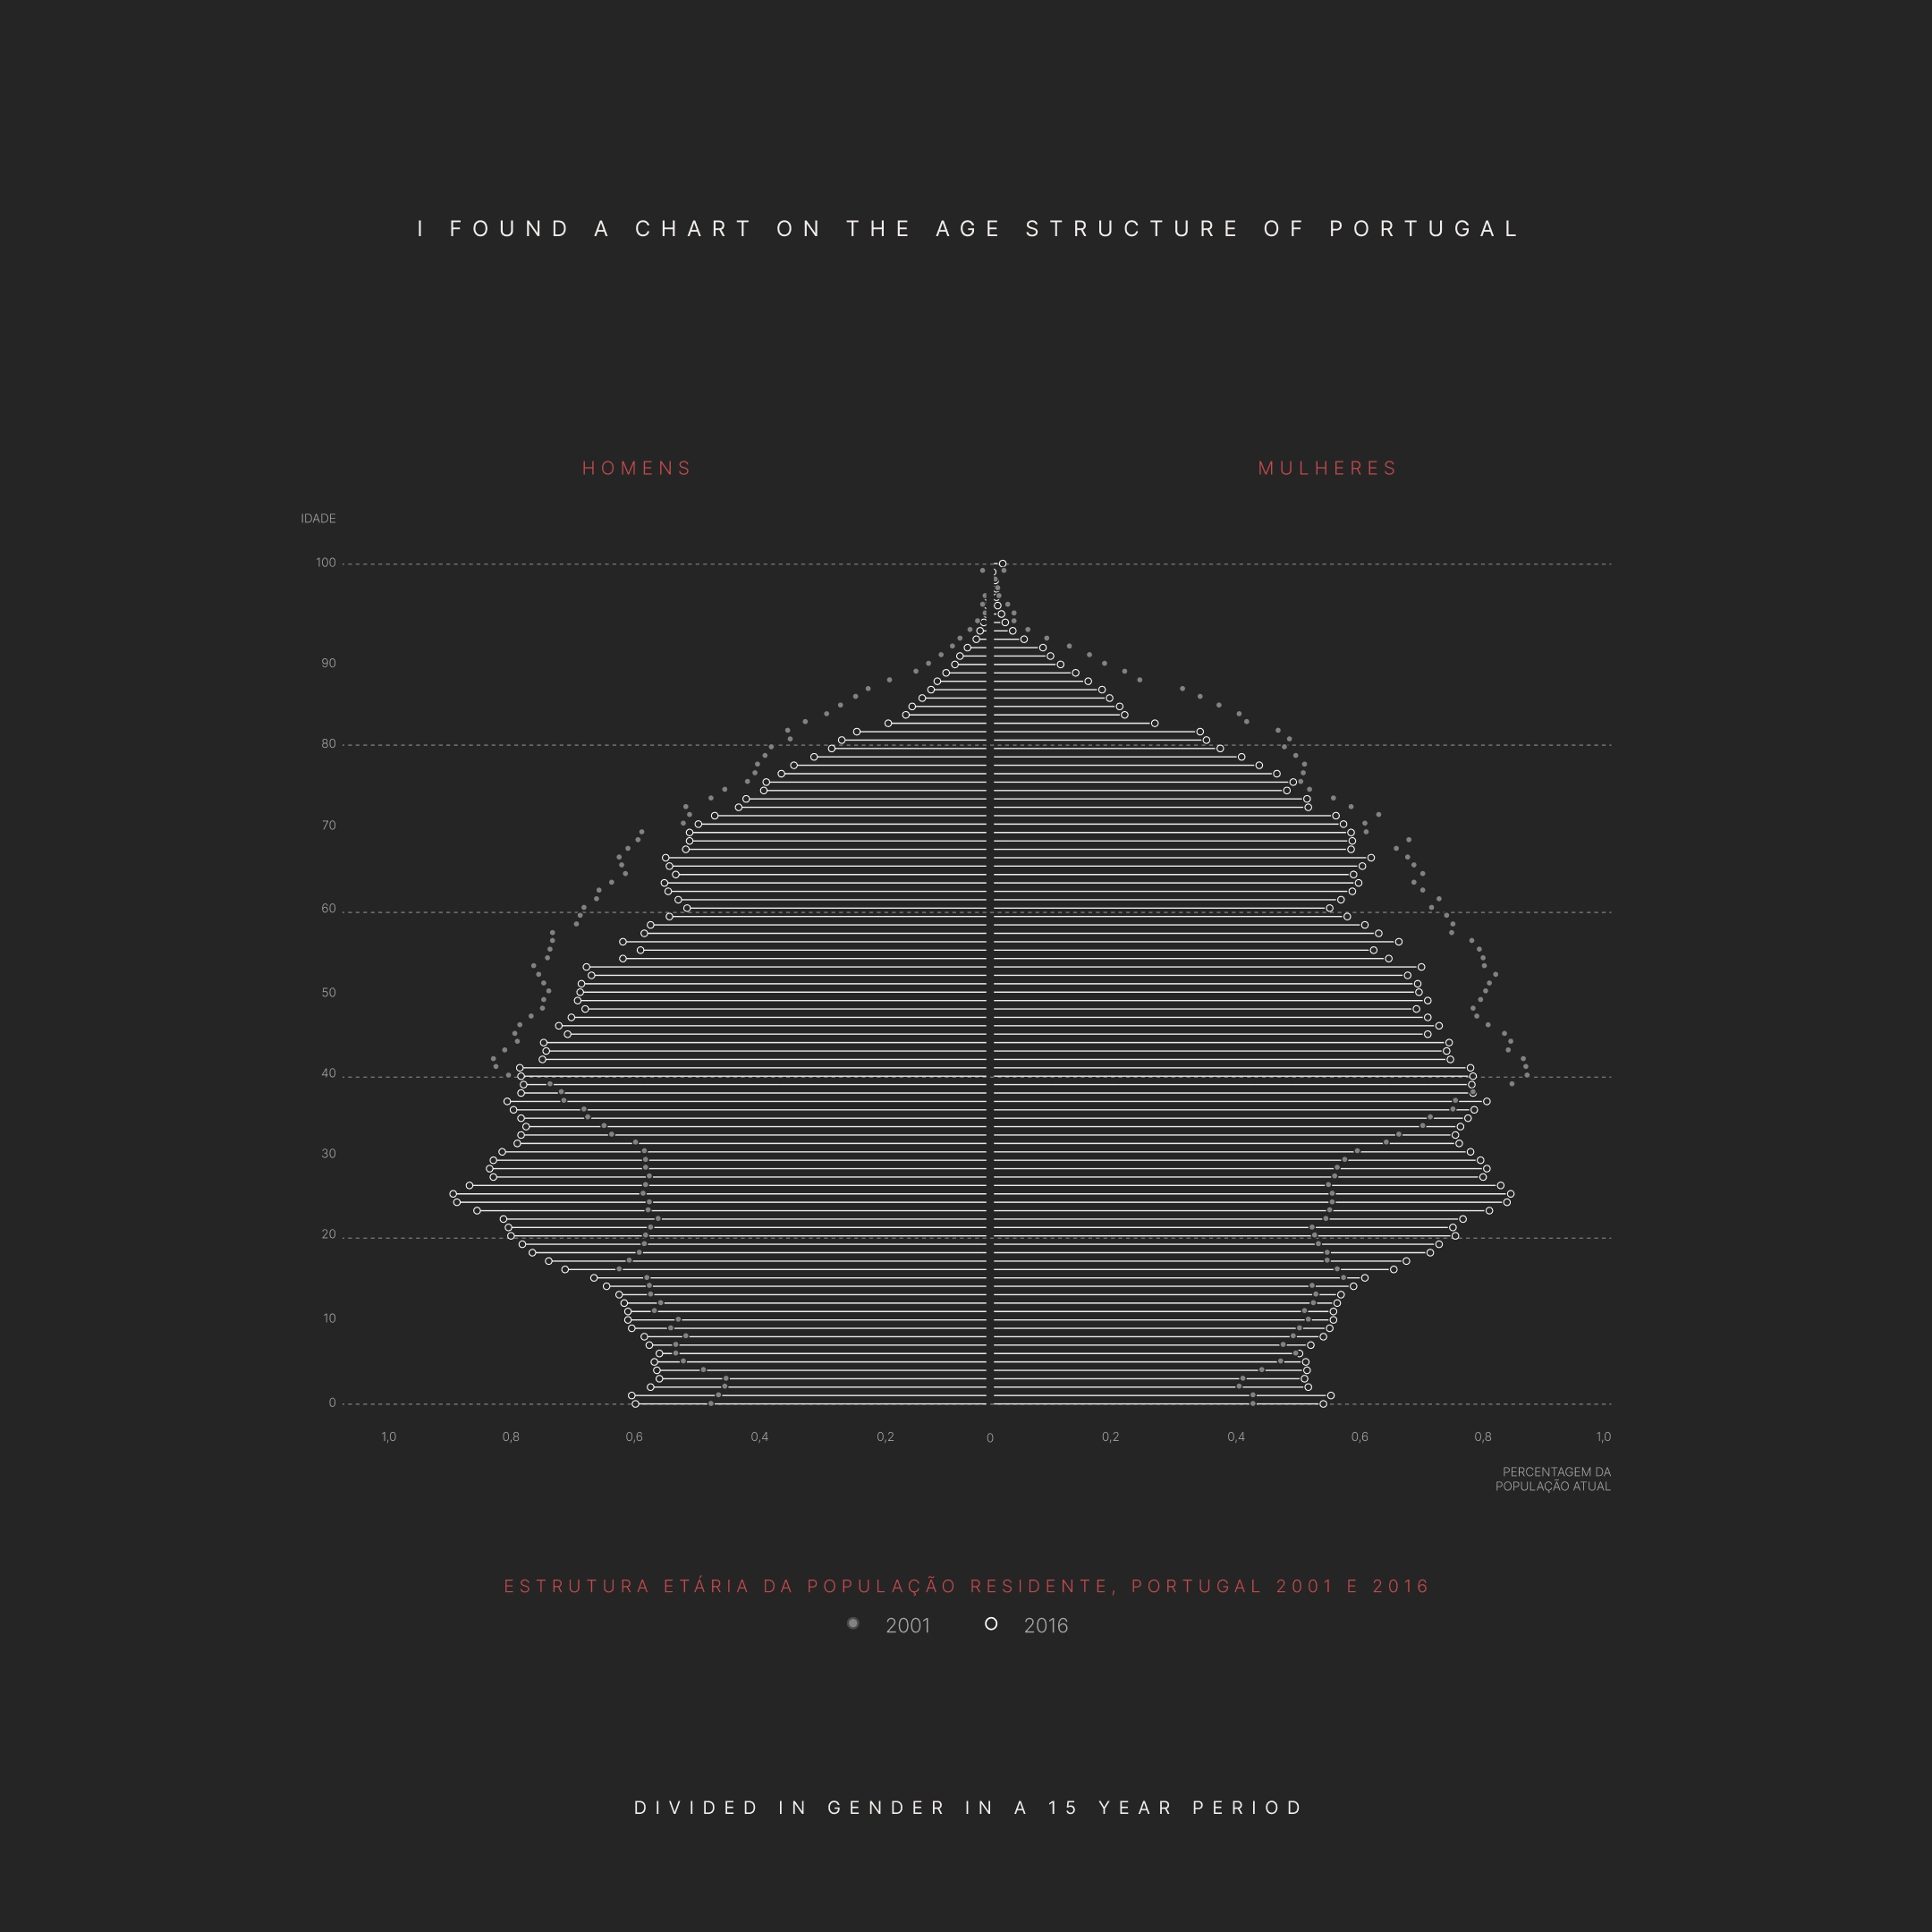
I found data on the age structure of Portugal and wanted to do something with that.
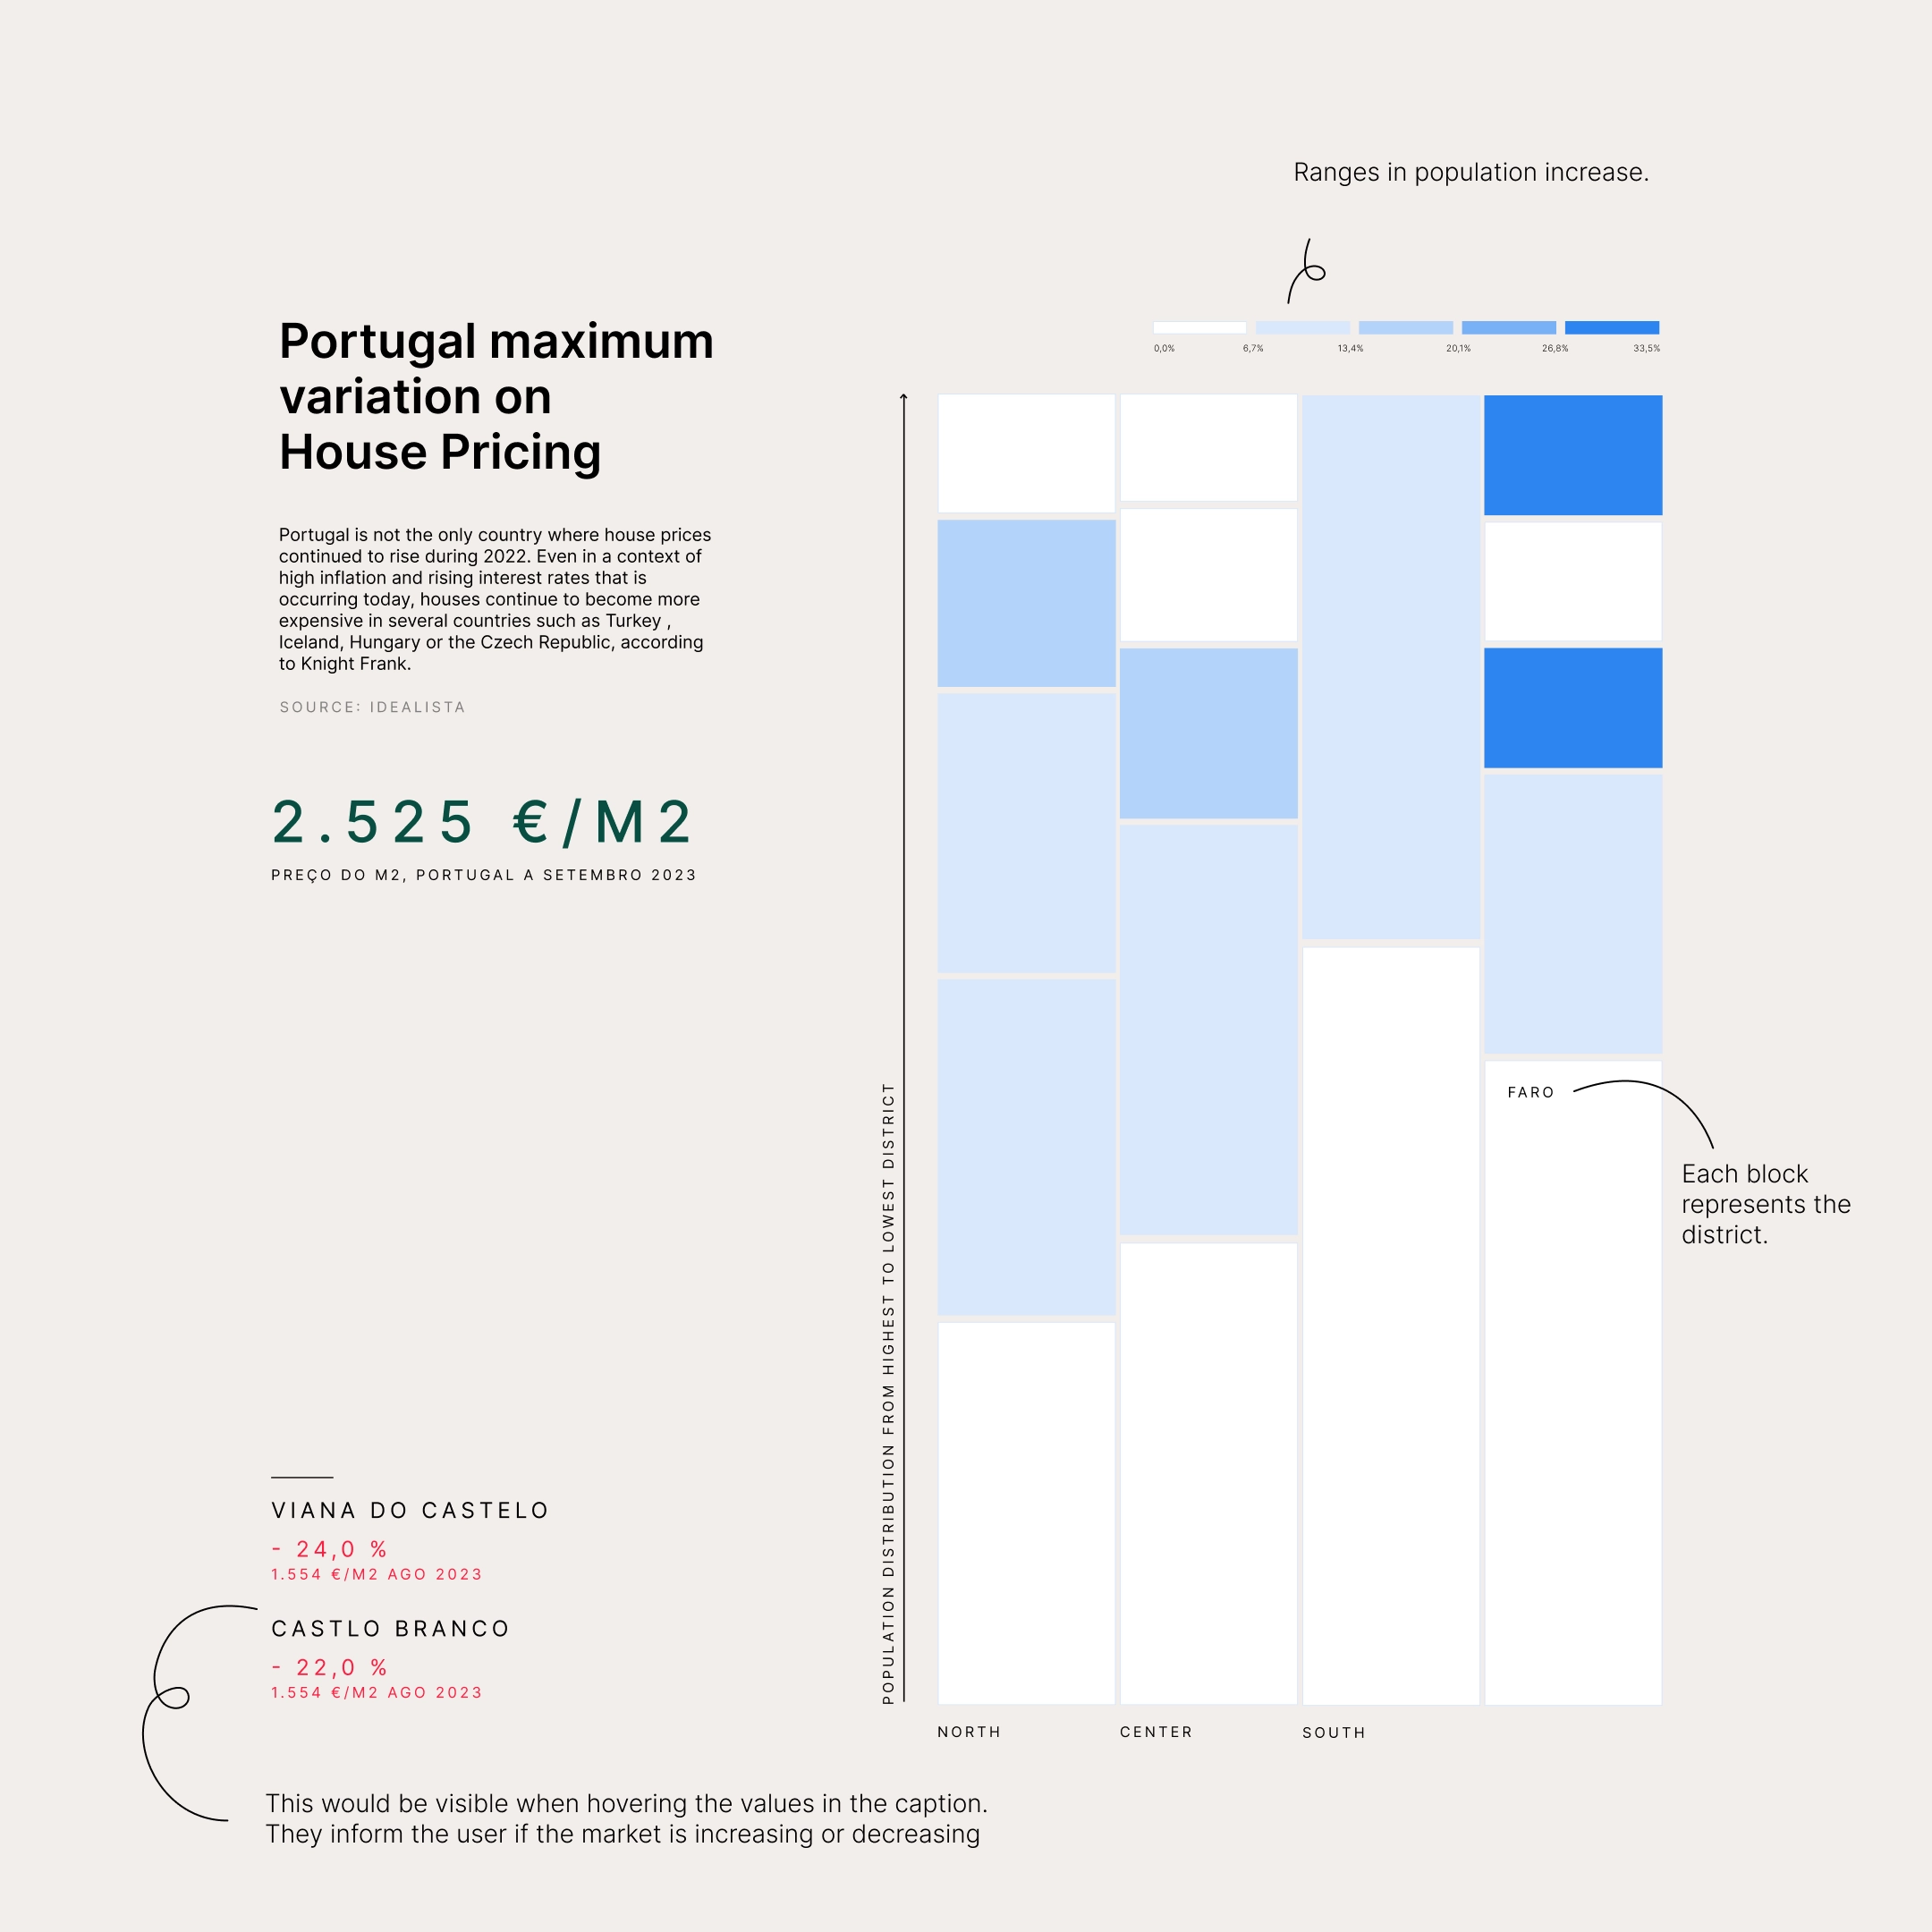
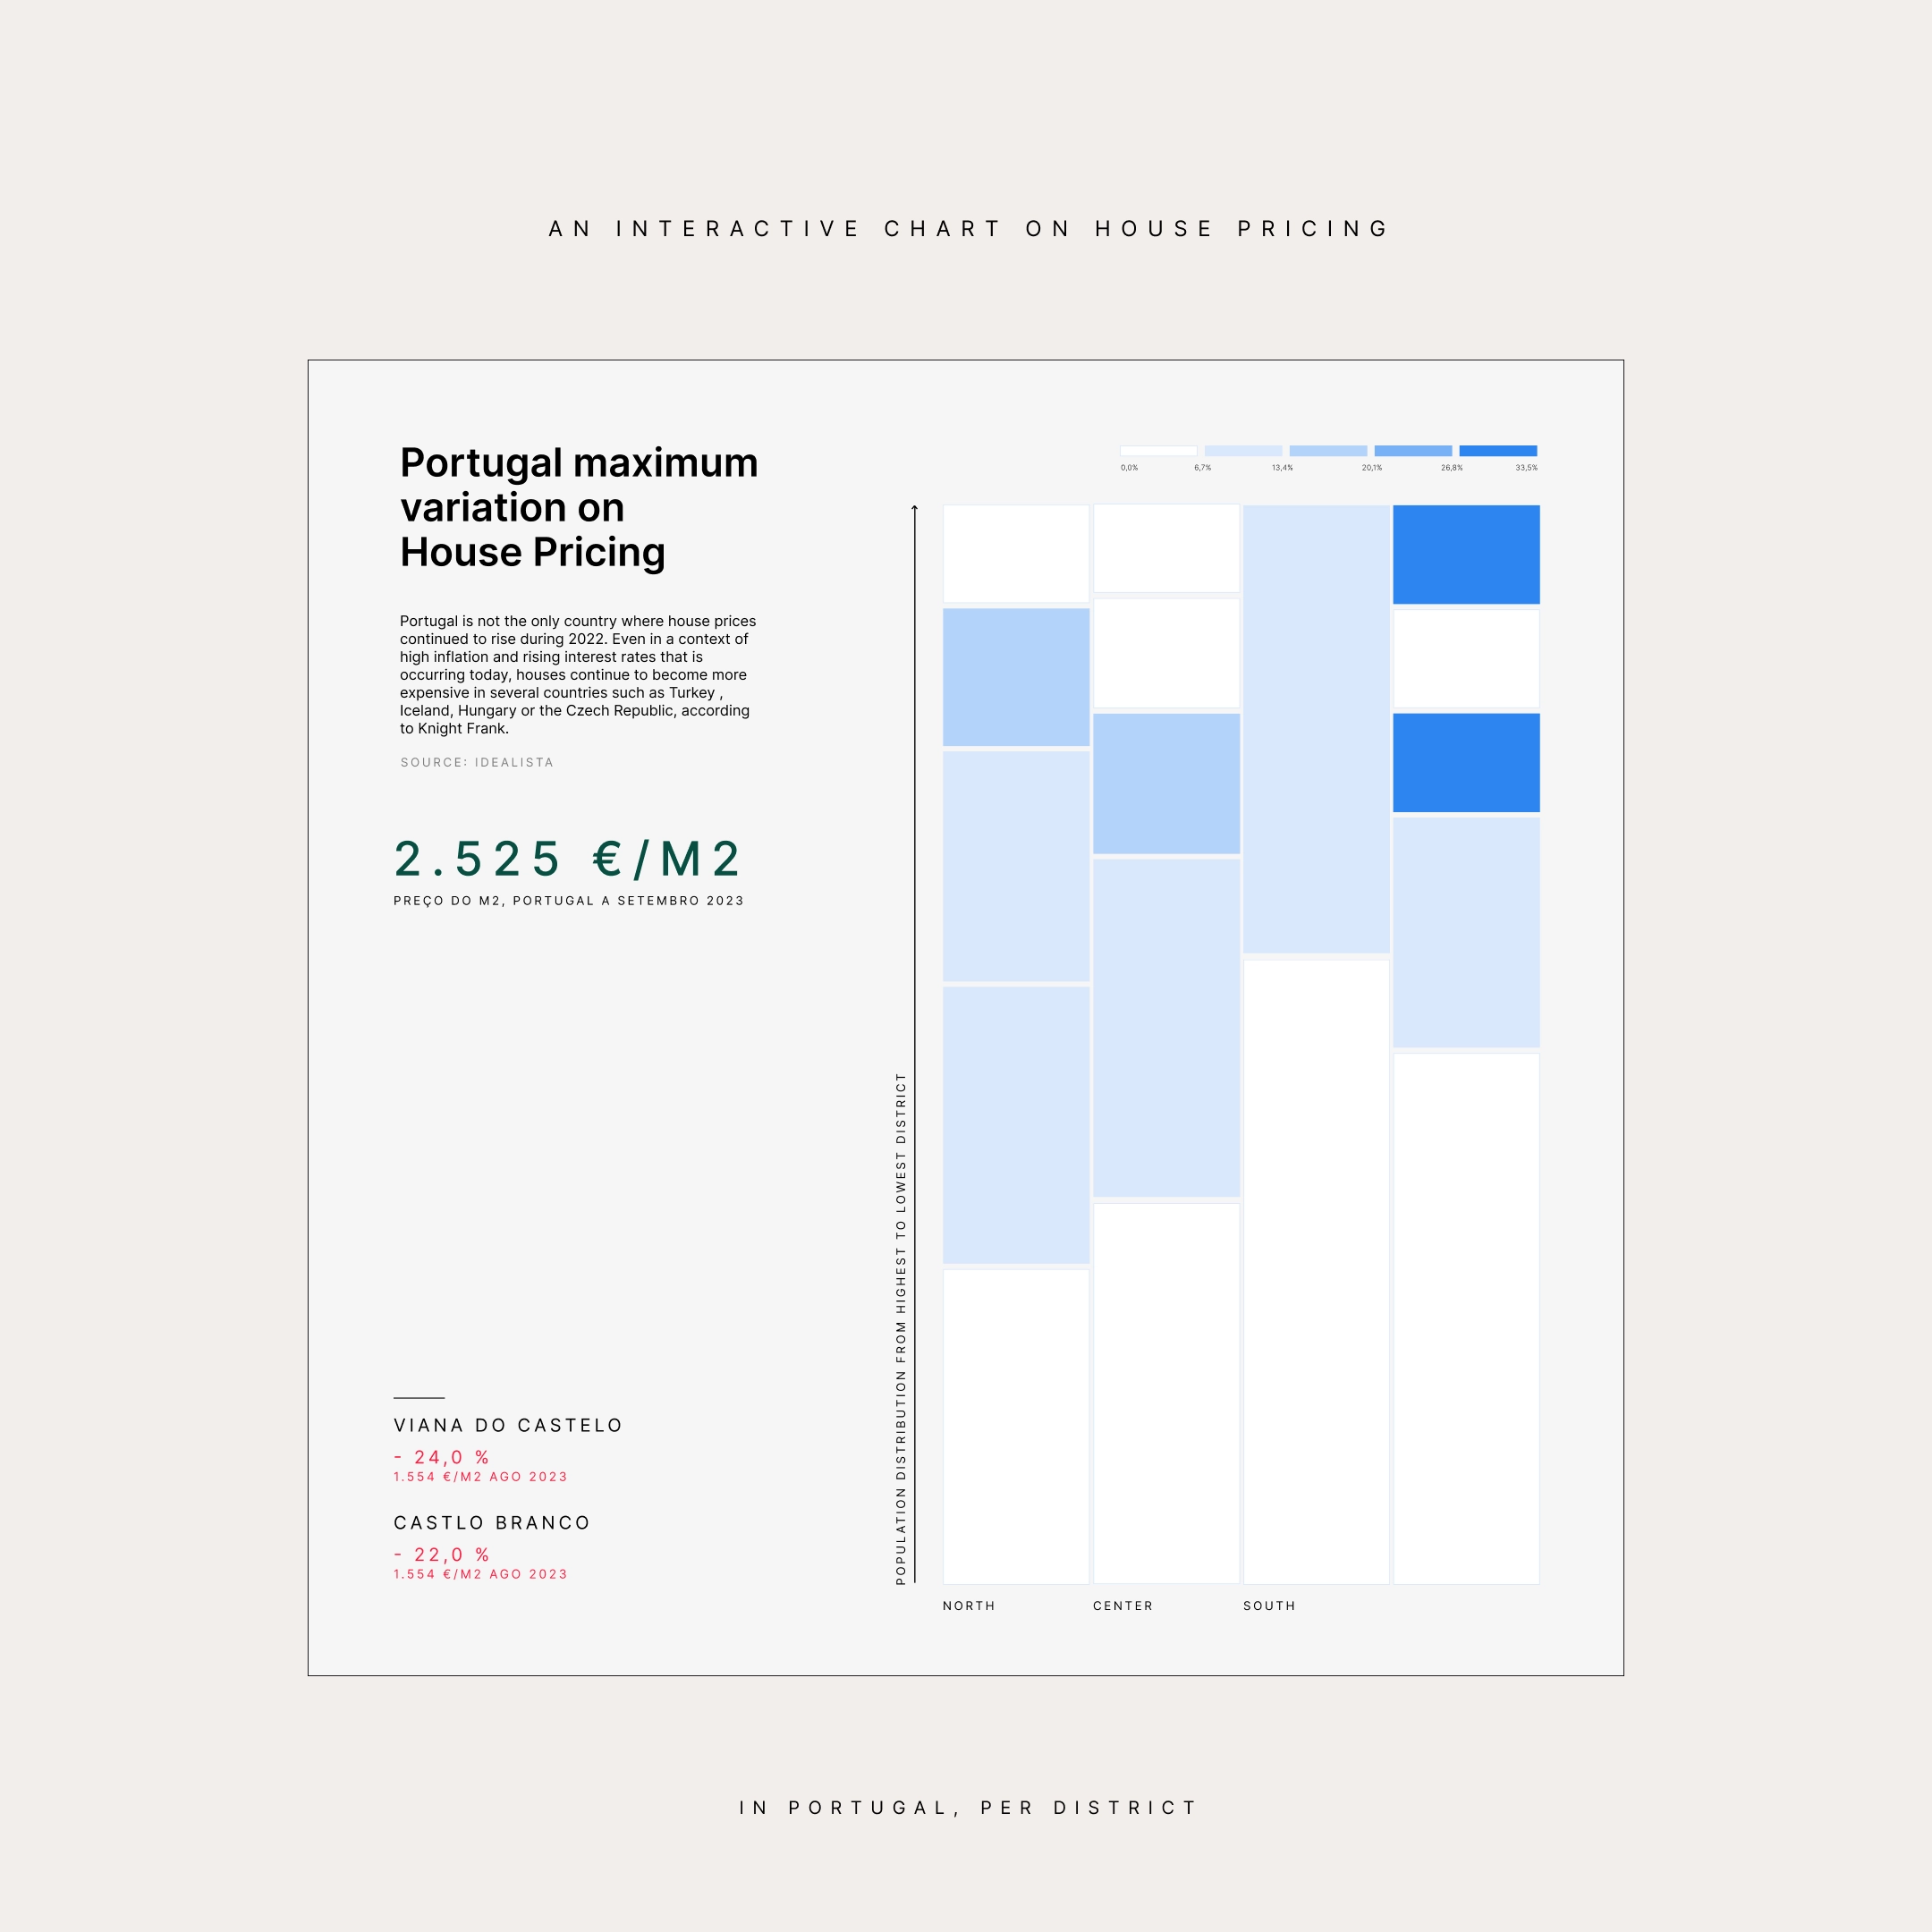
A concept of an interactive chart of house pricing without being actually interactive.
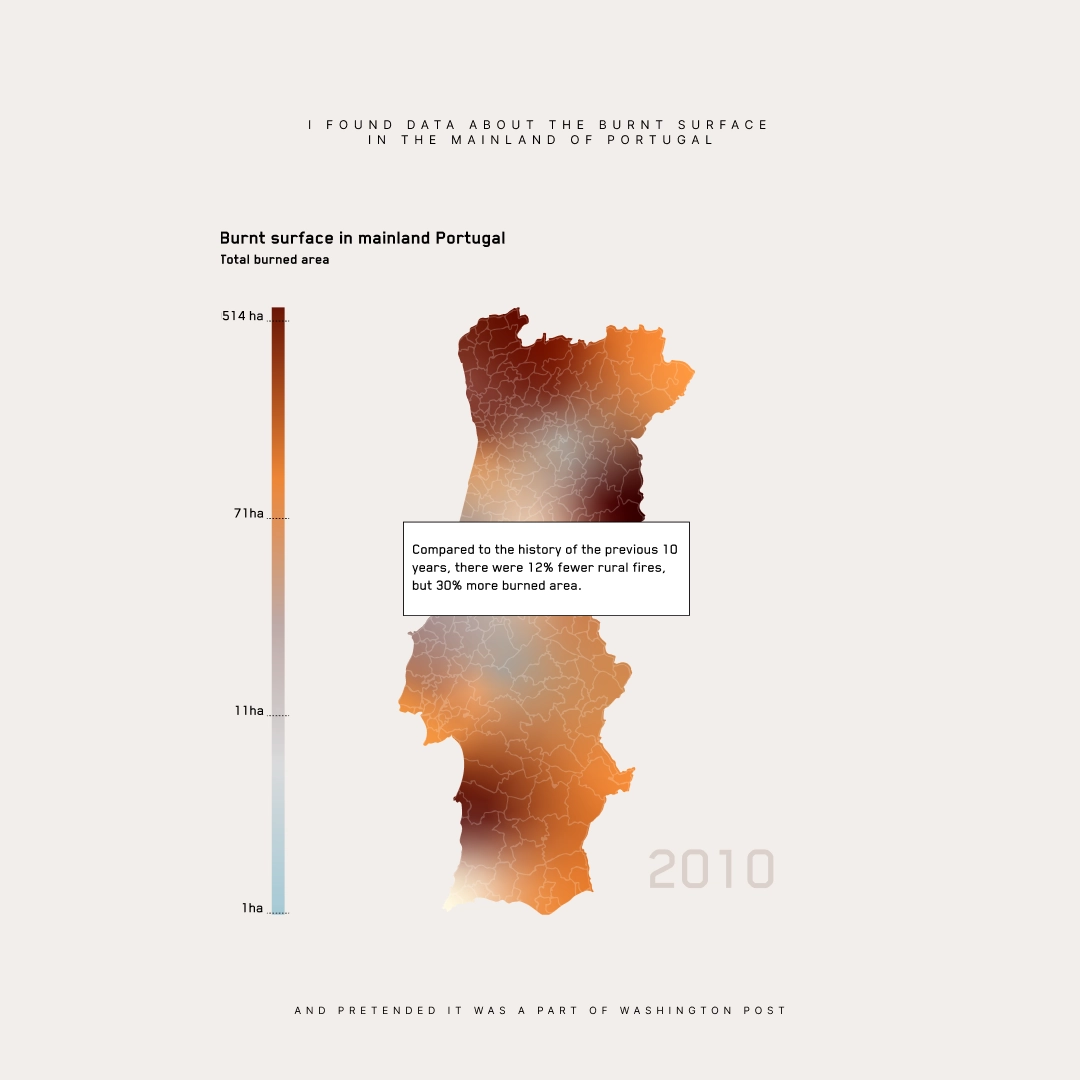
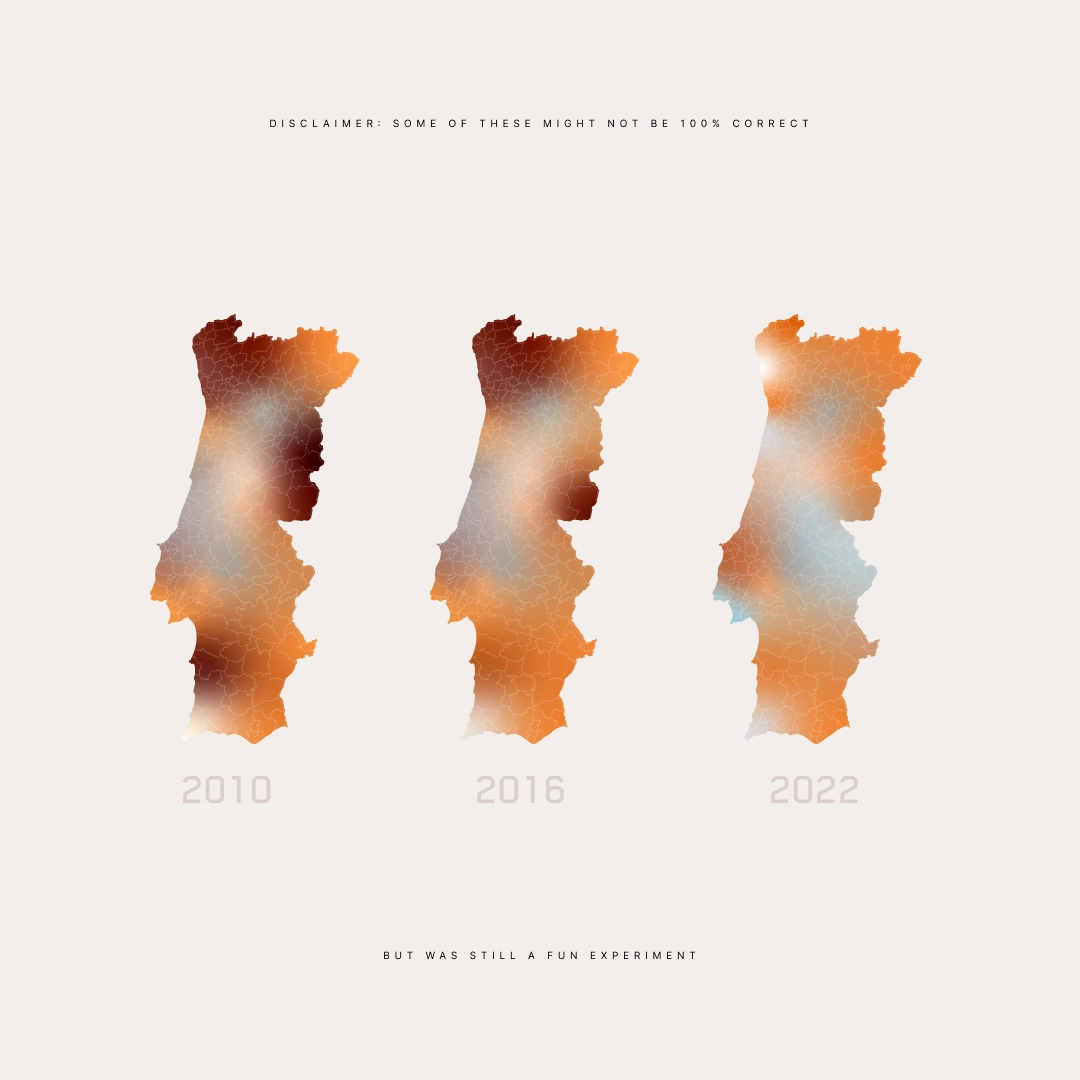
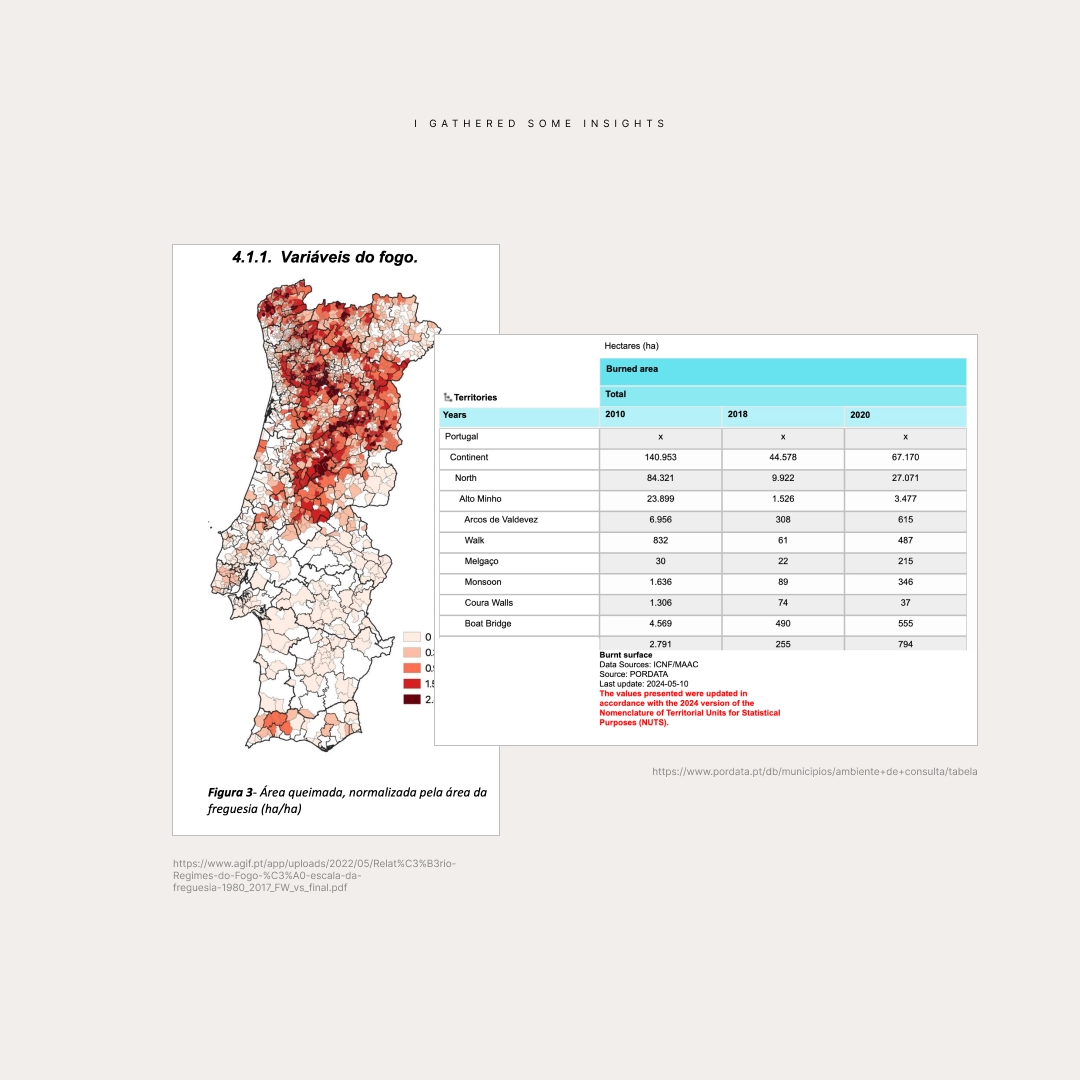
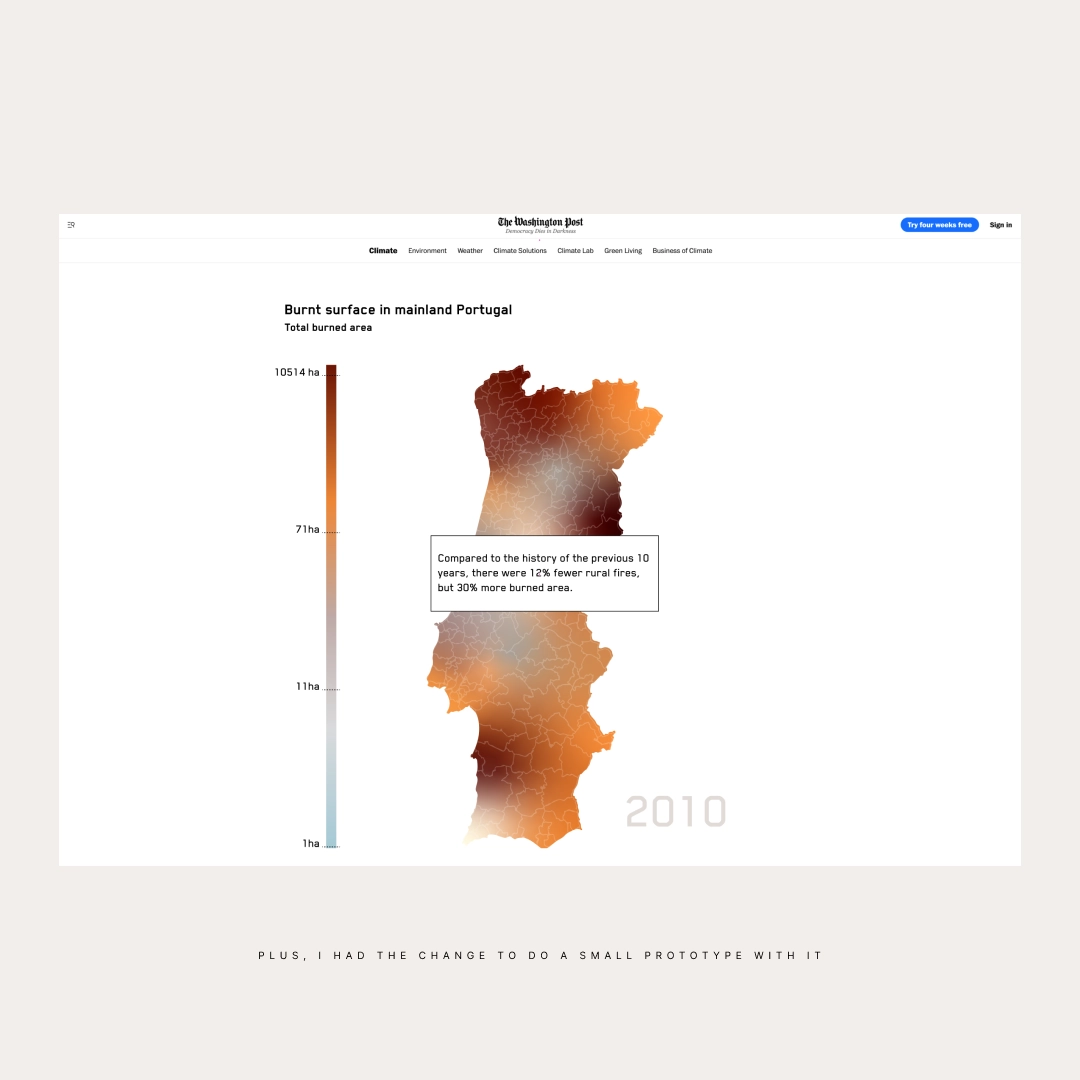
Still somewhere end 2023 I found data about the burnt surface in the mainland of Portugal And pretended it was a part of Washington Post.
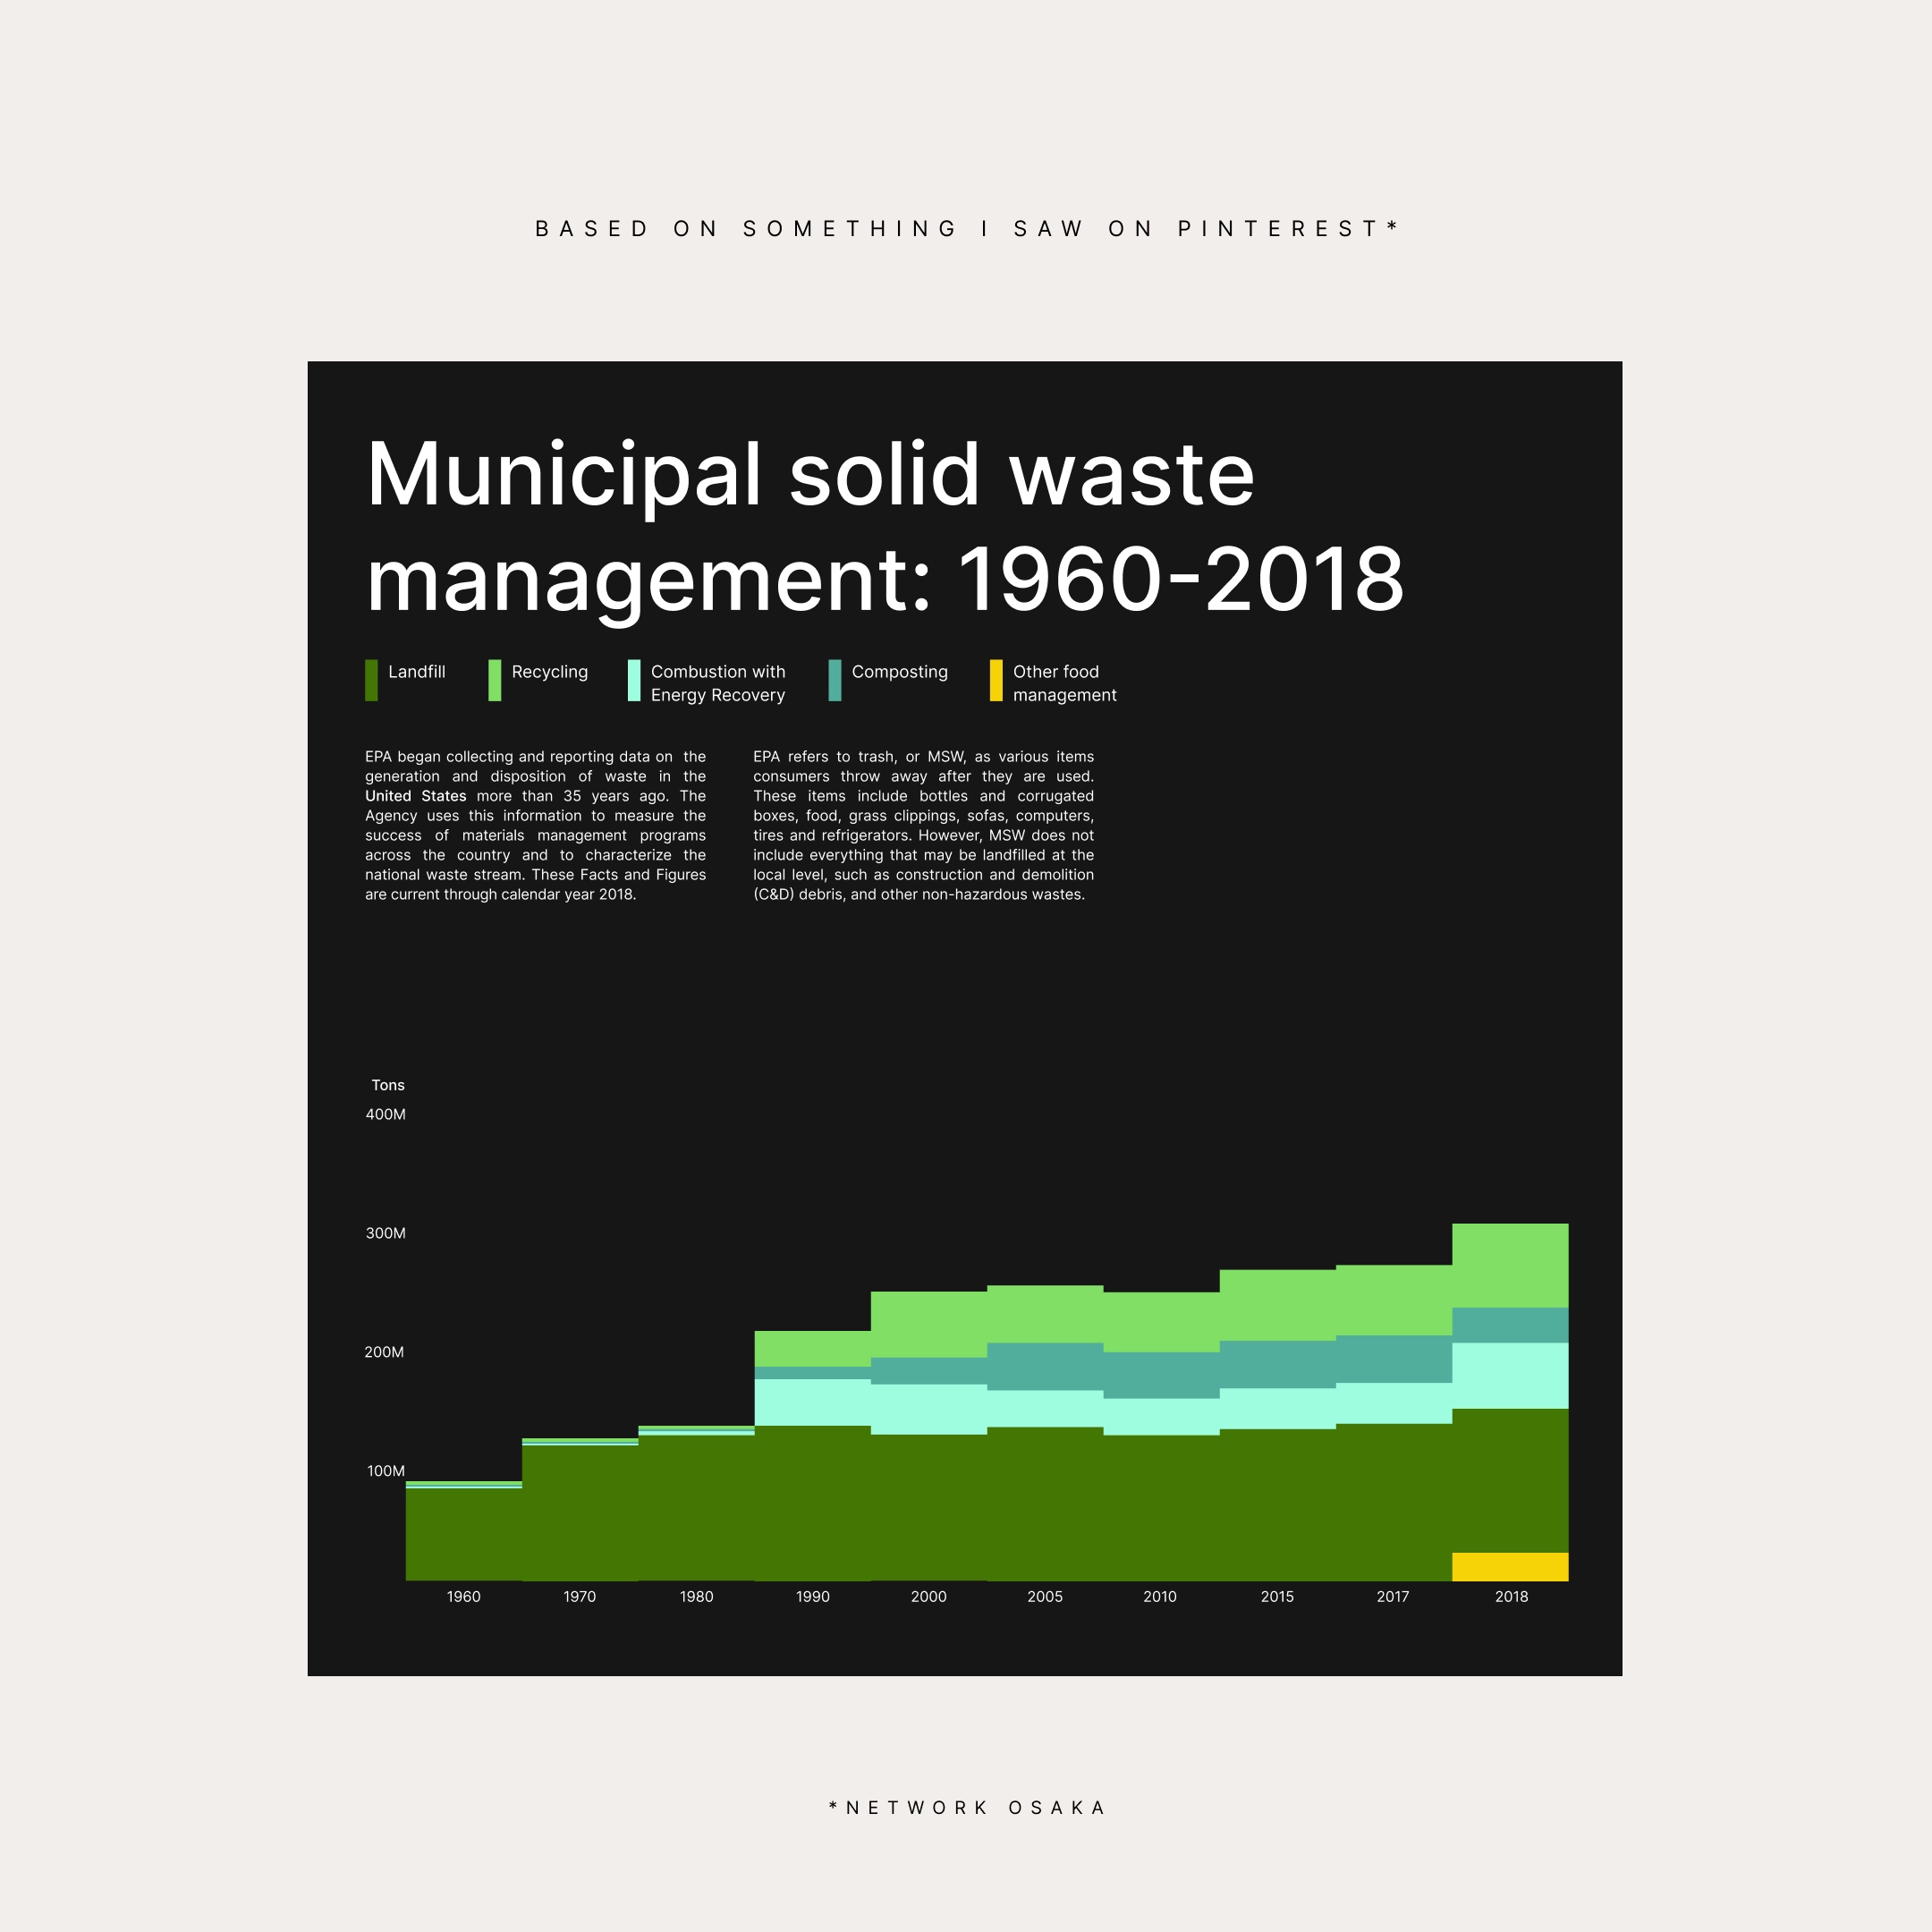
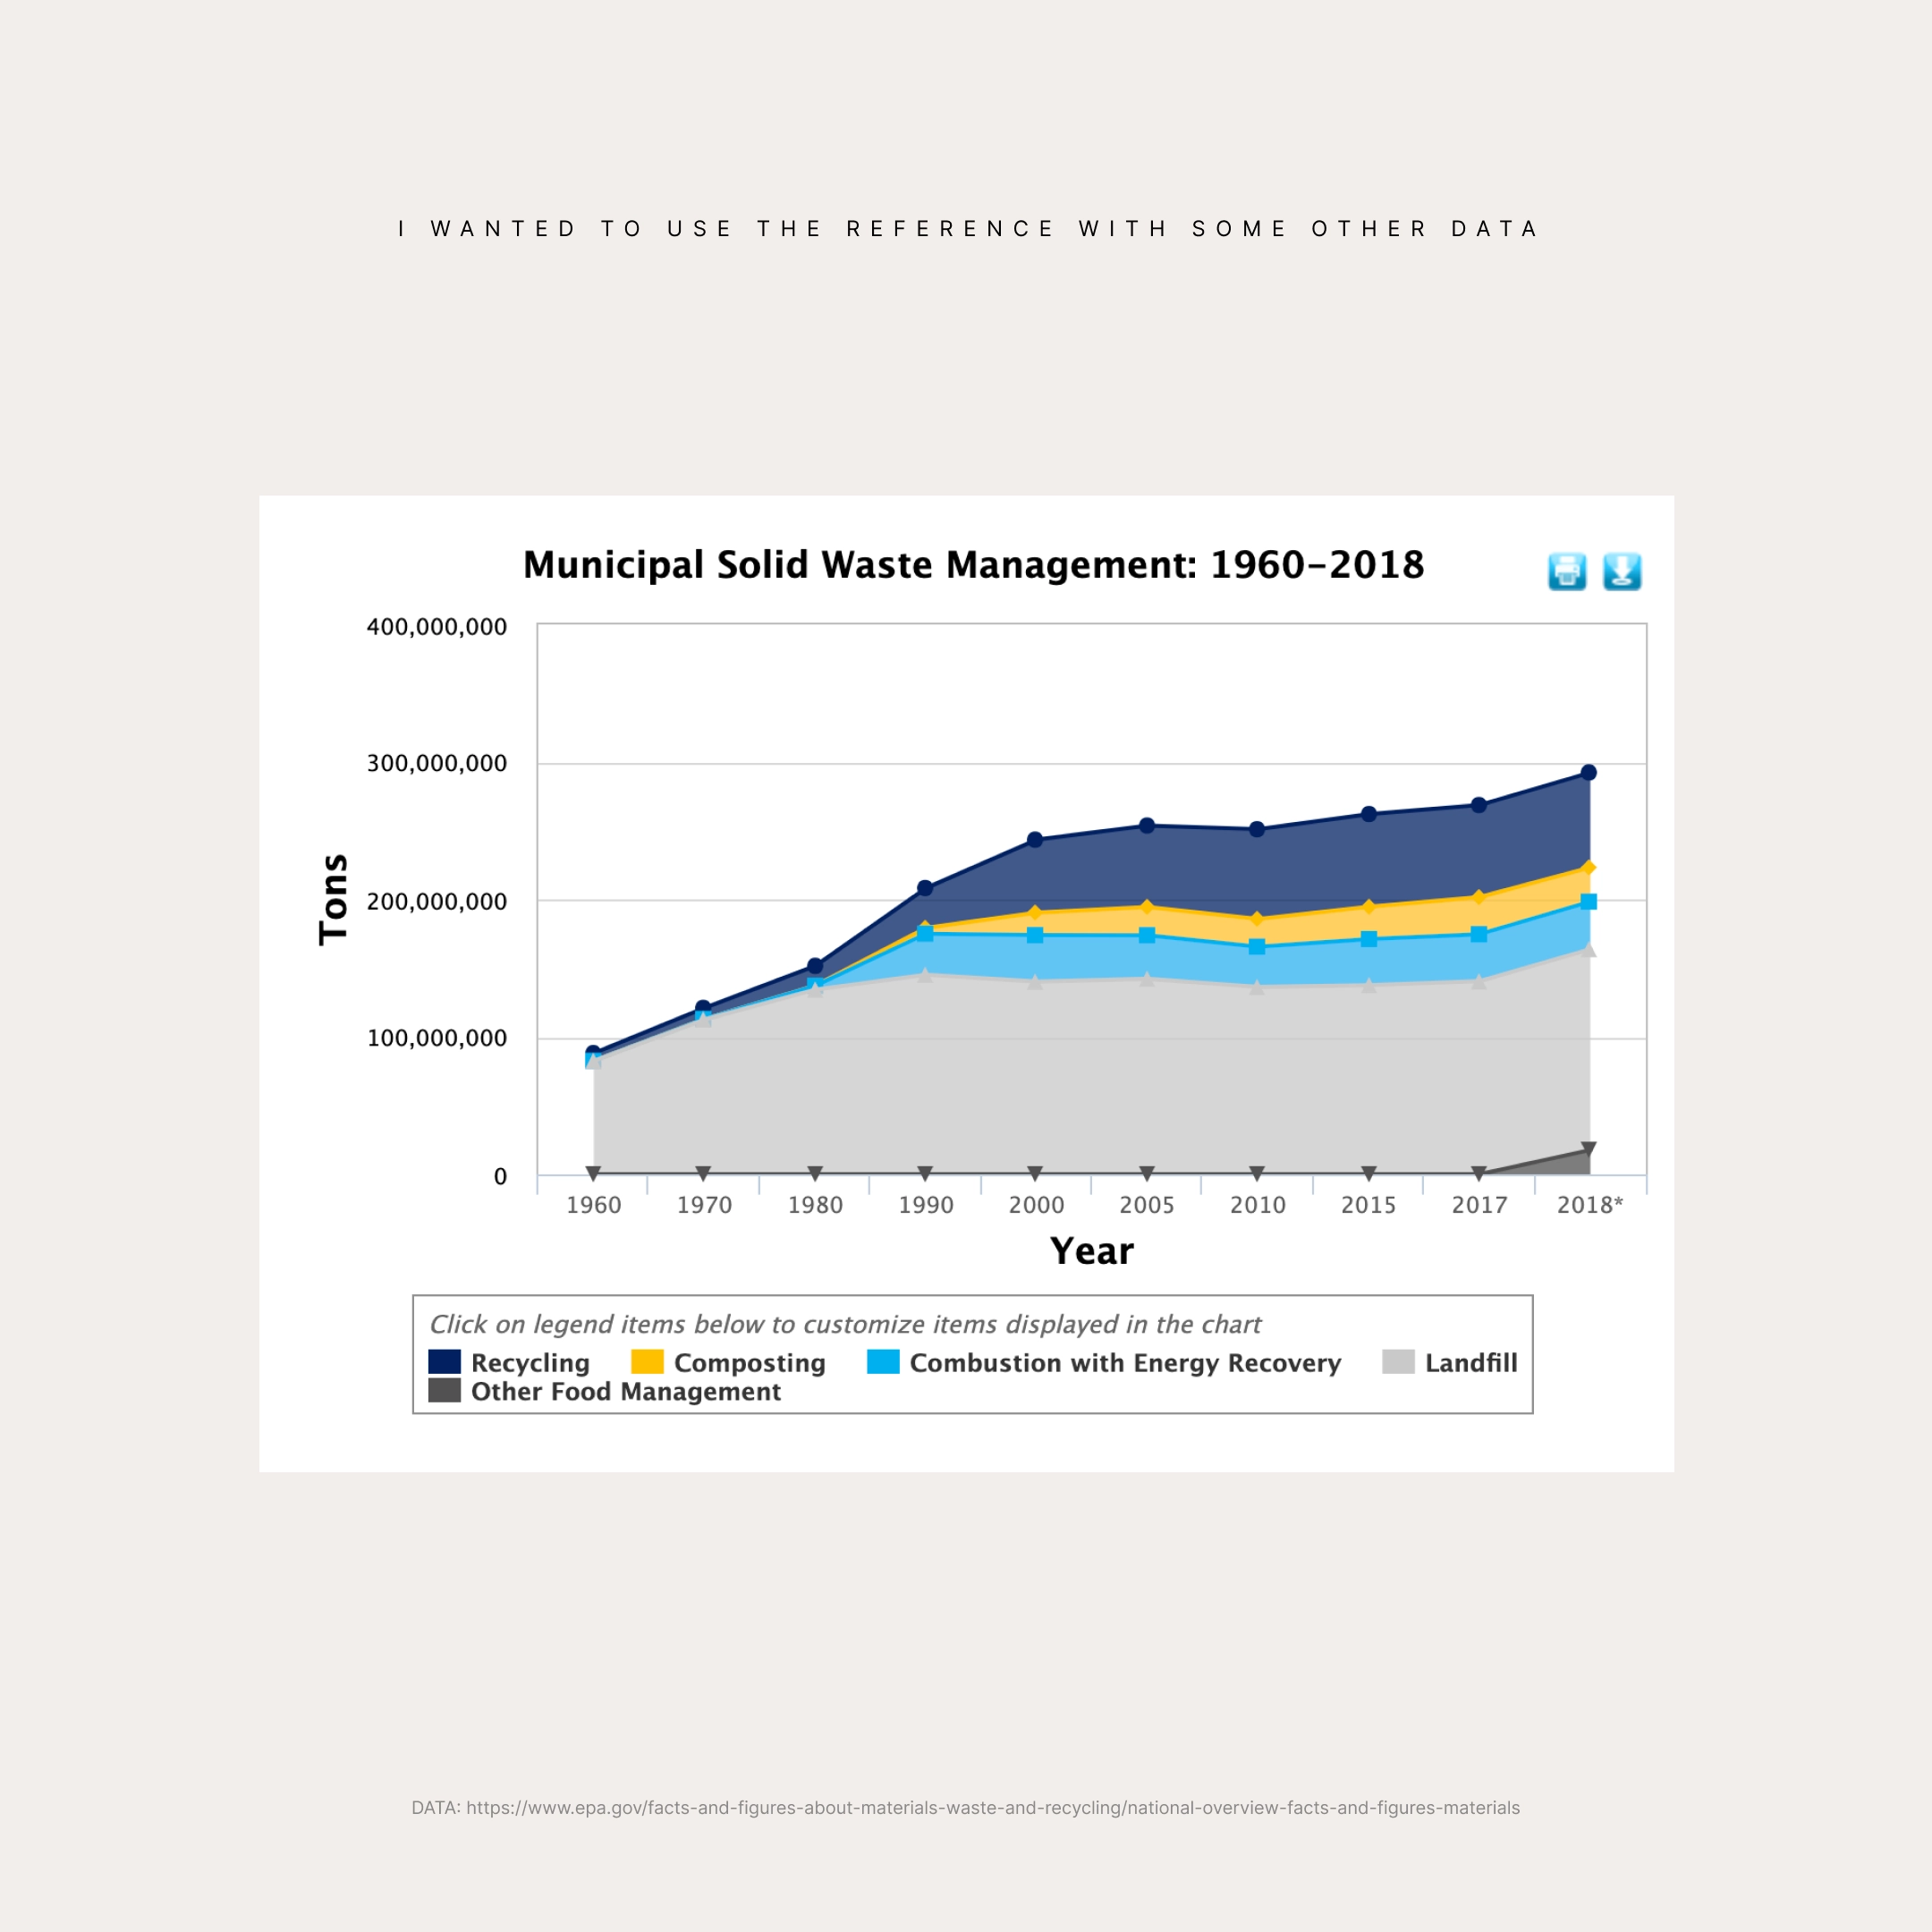
In September 2023, based on something I saw on pinterest by Network Osaka.
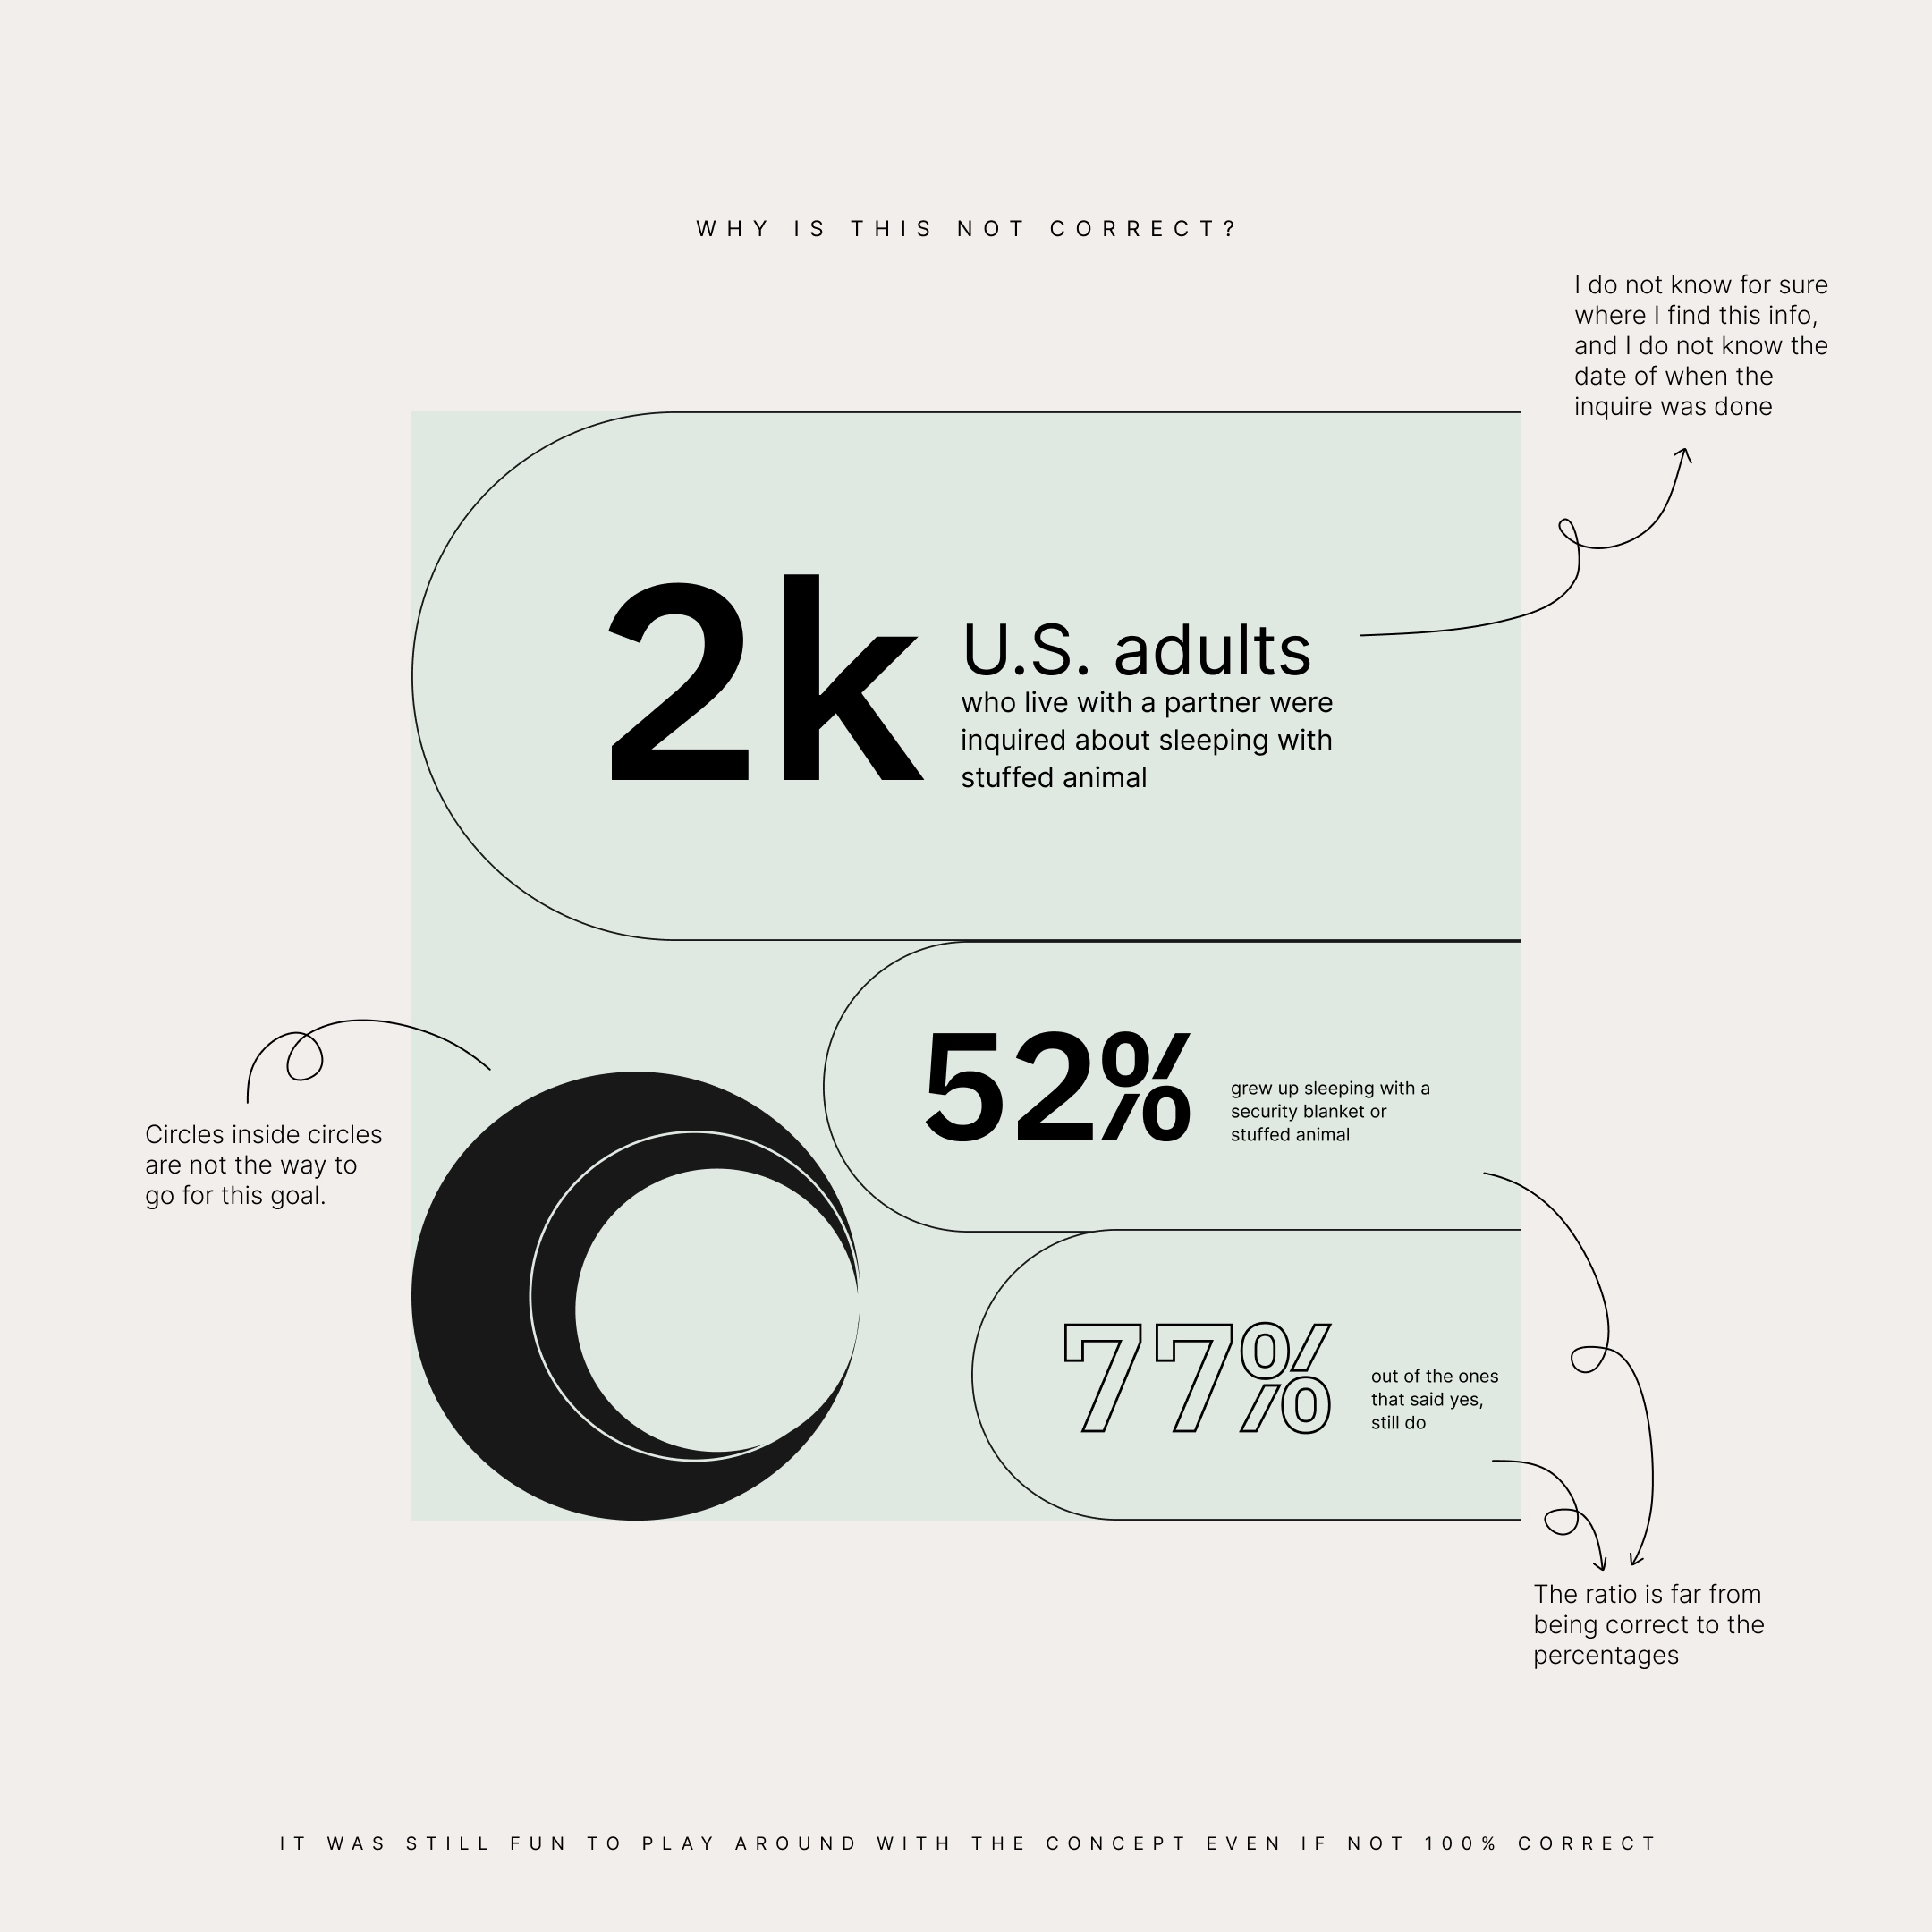
First thing I did, 18 of August 2023. I saw this thing about adults sleeping with their stuffed animal, plus I wanted to test prototype with Figma.